


October 2023 Commentary
September 2023 and Year-to-Date Market Performance
Third-quarter returns were largely negative, driven by a realignment of market sentiment from the collective conviction that the Fed would have to cut rates in late 2023 or early 2024 to a more realistic belief that rates would stay “higher for longer.” As an example, the 10-year US Treasury yield increased by 0.73% over the quarter, while the S&P 500 declined by 3.27% (see Exhibit 1).
The decline in the S&P 500 can be broken down into a positive 3.21% return in July, followed by a negative 6.28% combined return over August and September.
So far in October (as of October 18th), equities have recovered by about 0.7%, while the 10-year UST yield has flirted with a 5% level.
Geopolitical volatility has been notably muted, but that can change quickly if the war between Israel and Hamas escalates into a regional conflict.
Exhibit 1. 2023 Monthly and Year-to-Date Returns
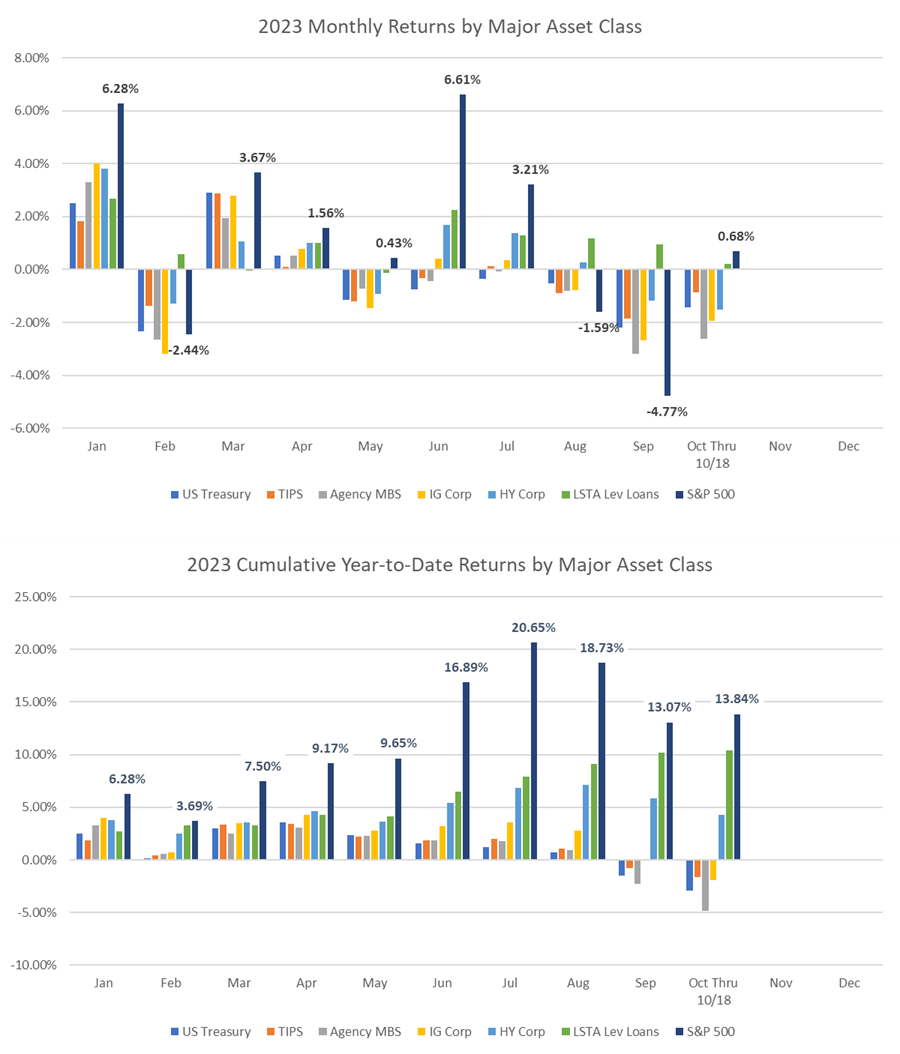
Source: Bloomberg, AAFMAA Wealth Management & Trust
Economic and Market Commentary
Among economists and market participants, there’s a practice (an obsession really) of trying to forecast inflation, unemployment, GDP growth, the timing of recessions, the impact of geopolitics, and a host of other less well-known macroeconomic variables. Everyone would always like to know where interest rates and equity prices are going, and insight into the economy would seem essential. As a result, investment hypotheses are often built on real or imagined links between the macroeconomy and specific market sectors, industries, and individual holdings.
The reality is that short-term changes in interest rates and equity prices are inherently unpredictable regardless of the quality of our models. If that weren’t true, we’d all be Warren Buffett. As we tactically adjust portfolios, we therefore need to be careful about becoming too attached to any one thesis, which, despite our level of conviction, might or might not play out. The good news, however, is that while we can’t predict short-term returns, we can estimate the potential range of returns and the risk of holding specific sectors, industries, and companies. If we can estimate risk, we can manage it. If we can manage risk, then, given the nature of financial markets, we can pursue long-term returns with some degree of confidence. And that, of course, is the basis for modern wealth management.
Our team actively tracks and models macroeconomic developments and risk signals. Lately, we’ve been focused on trying to understand more about the possible future path of interest rates. As the Federal Reserve approaches the end of the rate hiking cycle, we’re less concerned with the absolute level of the federal funds rate and more concerned with the volatility of intermediate- and long-maturity US Treasury yields. For the purposes of this discussion, we’ll concentrate on the 10-year UST yield, which was 4.93% as of mid-morning October 19th, and we’ll explore two very different, equally credible approaches for determining possible outcomes over the three months ending in mid-January 2024.
The Federal Open Market Committee sets the federal funds rate, which is one of the primary tools that the Fed uses to implement monetary policy. The Fed funds rate, which has often been referred to as the monetary “policy rate,” is critically important because it is the rate that banks charge each other for overnight lending. As the rate goes down, banks’ borrowing costs decline, and all else equal, banks’ propensities to borrow from each other and lend to businesses and consumers go up. Conversely, as the rate goes up – as it has for the past year and a half – banks’ borrowing costs increase, and their propensities to borrow and lend decline. Since March 2022, the FOMC has raised fed funds from near 0% to 5.33%. Most economists, including those at the Fed, agree that we’re near the end of the hiking cycle. In fact, after its September meeting, the FOMC projected that fed funds would hit a peak of about 5.6% at the end of this year. That would imply one more rate hike of about 0.25%.
When it comes to longer-term rates like the 10-year, the story becomes a little more complicated. As you can imagine, various frameworks have been developed to determine the “fair” value of a Treasury note or bond – in other words, given the current economy, what should the yield of the 10-year Treasury be? The frameworks often involve decomposing and then reconstituting the yield of the Treasury into contributions from factors like inflation expectations, demand from foreign investors, the amount of government debt, and so on. The models have a mixed track record when used to predict a single likely yield. They are more valuable when they are used to predict the range of possible outcomes.
To that end, our approach is less about forecasting the specific level of the 10-year UST yield, and more about understanding how much higher or lower the yield can realistically go. Market pricing itself provides a strong starting point. Beginning in the 1960s and continuing with the development of the Treasury options market, bond investors and academics developed a set of methodologies that allows us to estimate a probability distribution for future yields. Exhibit 2 shows the approximate distribution of the 10-year UST yield for mid-January 2024 using these methods.
Exhibit 2. Approximate Distribution of the 10-Year UST Yield Three Months from Now
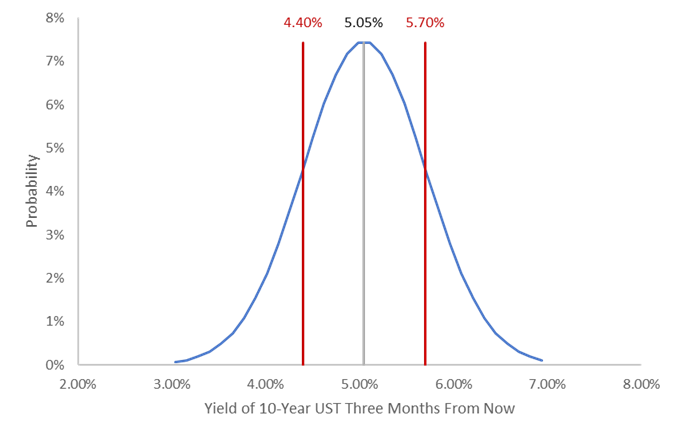
*As of 10/19/2023; the gray line represents the implied forward 10-year UST yield, and the red lines denote the implied forward yield plus or minus the implied volatility of the three-month forward, 10-year UST swaption. In plain language, the implied forward is based on a methodology that assumes that the expected return of all US Treasures over a given period (regardless of which UST an investor owns) will equal the yield of the UST maturing at the end of that period. The calculation of implied volatility assumes that Treasury returns follow a random path over the period with an expected return equal to the yield of the UST maturing at the end of the period; the implied volatility is the standard deviation of all possible future returns that most closely matches market pricing. We know that’s a lot of statistics, but just wanted to provide a little background!
Source: Bloomberg, AAFMAA Wealth Management & Trust
Exhibit 2 tells us that the expected yield is 5.05% and that the likely range of outcomes is between 4.40% and 5.70%. As we noted above, and for the reason we describe below, we’re much less interested in the expected level than the range of possibilities.
Exhibit 3 provides the justification for paying attention to this analysis. The blue curve shows historical monthly yields of the 10-Year UST from January 2006 through September 2023, and the gray-shaded region shows the likely range of yields on each date forecasted three months earlier using this methodology. The red columns show the difference between the actual and expected yields. On average, the actual yield was 0.38% higher or lower than the expected yield, which is equivalent to an average forecast error in three-month total returns of 3.0% to 3.5%. In a market where every 0.01% makes a difference, that’s significant.
However, despite the poor forecasting accuracy of the expected yield, the estimated likely range of yields has been quite accurate. We know this because (1) the historical yields almost always fall inside the gray-shaded region representing that range, and (2) there are plenty of months when the historical yields approach one of the boundaries of the gray region. The gray band is wide enough to contain the majority of realized yields but not so wide that any value would fit.
Exhibit 3. Historical 10-Year UST Yield and 3-Month Implied Forward UST Yield, Jan 2006 – Sep 2023
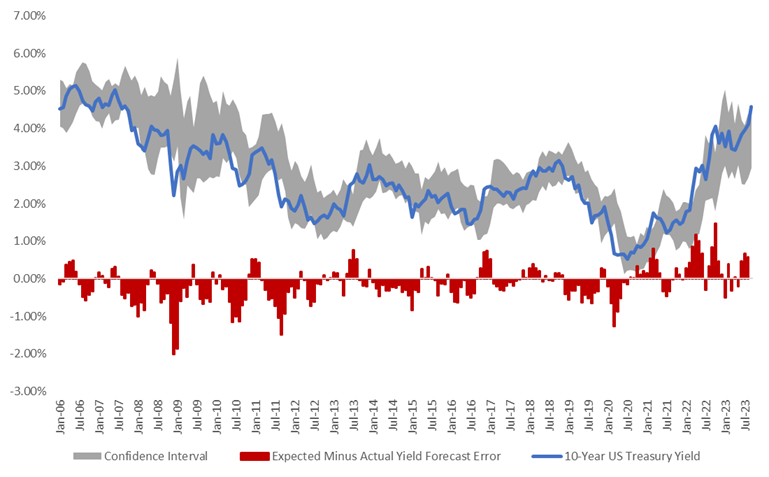
*The Confidence Interval is represented by implied volatility of the three-month forward, 10-year UST swaption.
Source: Bloomberg, AAFMAA Wealth Management & Trust
Statistically, this methodology suggests that the 10-year yield in mid-January 2024 will likely land between 4.40% and 5.70%. But what is the insight behind the statistics?
It would be convenient if there were clear and obvious correlations between the expected change in yields and measures like unemployment, GDP growth, and government spending. Unfortunately, there aren’t. So, to answer that question, we look directly at the relationships among the 10-year UST yield, the fed funds rate, and a related measure we call the “true policy rate.” We also look indirectly at inflation to the extent that is captured by the fed funds rate and the 10-year UST yield.
While, as we noted earlier, the fed funds rate is critically important, the Fed has also used its balance sheet in recent years to further monetary policy. This practice started in late 2008 during the Great Financial Crisis and works like this: as an alternative to cutting or hiking the fed funds rate, the Fed can seek to push interest rates lower or higher by buying or selling securities (primarily US Treasuries and agency mortgage-backed securities). That creates excess positive or negative demand that drives prices higher or lower than they would have moved based solely on investor needs. When the Fed buys securities for this purpose, it’s called quantitative easing; when it sells securities for this purpose, it’s called quantitative tightening.
Many economists believe that the dollar amount of securities purchased under quantitative easing can have an equivalent impact on the Fed lowering the fed funds rate by some number of percentage points. That’s important because, with enough rate cuts, fed funds would eventually approach 0%. Unlike other central banks in the post-Great Financial Crisis and Covid eras, the Fed never wanted to reduce fed funds below 0% (yes, that is possible). Instead, when fed funds did approach 0%, the Fed stopped cutting rates but continued to provide stimulus by buying several trillion dollars of securities, most of which are still on their balance sheet.
We estimate that the interest rate equivalent of the extra securities that the Fed purchased and still owns is currently about -2.90%. That means that even though the fed funds rate is currently 5.33%, the “true policy rate” is approximately 5.33% minus 2.90%, or 2.43%, a much more stimulative level than fed funds alone would suggest. When we look at historical interest rate relationships, we therefore typically try to adjust for the size of the Fed’s balance sheet.
Independent of market pricing, we can also analyze what might potentially happen to the 10-year UST yield under three scenarios between now and mid-January 2024: (a) the Fed hikes fed funds one more time by 0.25%; (b) the Fed leaves rates unchanged; and (c) the Fed cuts rates once by 0.25%. Our projection is based on the historical response of the 10-year UST yield to changes in our estimate of the true policy rate. In each case, we assume that the Fed continues to reduce its balance sheet at the same pace that they have been. As a result, in (a) and (b), the true policy rate increases by more than the change in fed funds, and in (c), the true policy rate decreases by less than the change in fed funds.
Under these scenarios, the analysis suggests that the 10-year in mid-January 2024 would likely trade in a range between 4.12% and 5.56% (see Exhibit 4). These projections are close to the 4.40% and 5.70% range we discussed above which are implied by current market pricing.
Exhibit 4. Three Fed Funds Scenarios
|
|
Scenario (a) |
Scenario (b) |
Scenario (c) |
Implied by Market |
|
Fed hikes rates by 0.25% |
Fed leaves rates unchanged |
Fed cuts rates by 0.25% |
|
|
|
Current 10-Year UST Yield |
4.93% |
4.93% |
4.93% |
4.93% |
|
Current True Policy Rate |
2.90% |
2.90% |
2.90% |
2.90% |
|
Forecast Change in True Policy Rate |
0.43% |
0.14% |
-0.19% |
|
|
Forecast Change in Yield Curve Slope |
-0.33% |
-0.11% |
0.15% |
|
|
Forecast 10-Year UST Yield |
4.60% |
4.82% |
5.08% |
5.05% |
|
Likely Lower Range of Estimated Yield |
4.12% |
4.34% |
4.59% |
4.40% |
|
Likely Higher Range of Estimated Yield |
5.08% |
5.31% |
5.56% |
5.70% |
*Low and high ranges based on one standard deviation differences from forecast.
Source: Bloomberg, AAFMAA Wealth Management & Trust
Where does that leave us? The analyses suggest that the 10-year UST yield in mid-January 2024 could fall in a credible range of about 4.12% to 5.70% with an expected level lower than today’s actual yield. In the recent past, notes and bonds with low-price sensitivity to interest rate changes have outperformed alternatives with higher price sensitivity. That has been true because interest rates have risen so much, and because note and bond prices go down when rates go up. If intermediate and long rates like the 10-year UST yield are more likely to begin falling, then it may be time soon to begin adding sensitivity to interest rates to our portfolios.
In this environment, we want to reiterate that money market funds have become a low-risk asset with yields currently above 5%. That makes cash allocations much more attractive than they were in the past when money markets yielded closer to 0%. We are still cautious about the potential performance of equities, especially given recent US political turmoil – including a potential government shutdown – and the war in the Middle East. As a result, we continue to be comfortable with our overall asset allocation, but, as always, will monitor the macroeconomy and geopolitical risks.
Yours in Trust,
Paul
Increase Your Financial Wellness with AWM&T
At AAFMAA Wealth Management & Trust LLC, we are committed to serving the unique financial needs of the military community. Whether you require a complimentary portfolio review, a comprehensive financial plan, assistance with your investment strategy, or trust services, our military wealth management professionals are ready to serve you. Contact us today to set up an appointment with a Relationship Manager who can assess your financial health and customize your personalized action plan.
About Us
Founded in 2012, AAFMAA Wealth Management & Trust LLC (AWM&T) was created to meet the distinct financial needs of military families. We proudly deliver experienced, trustworthy financial planning, investment management, and trust administration services – all designed to promote lasting security and independence.
We are proud to share the mission, vision, and values of Armed Forces Mutual, our parent company. We consistently build on the Association’s rich history and tradition to provide our Members with a source of compassion, trust, and protection. At AWM&T, we are committed to serving as your trusted fiduciary, always putting your best interests first. Through Armed Forces Mutual's legacy and our financial guidance, we provide personalized wealth management solutions to military families across generations.
© 2023 AAFMAA Wealth Management & Trust LLC. Information provided by AAFMAA Wealth Management & Trust LLC is not intended to be tax or legal advice. Nothing contained in this communication should be interpreted as such. We encourage you to seek guidance from your tax or legal advisor. Past performance does not guarantee future results. Investments are not FDIC or SIPC insured, are not deposits, nor are they insured by, issued by, or guaranteed by obligations of any government agency or any bank, and they involve risk including possible loss of principal.
Get In Touch!
Schedule a consultation with one of our expert financial planners today, and let's hit the fast-track to success!
Schedule A ConsultationRelated posts
May 2023 Market Commentary
Read more
June 2023 Market Commentary
Read more