


July 2023 Market Commentary
From the 1967 movie The Graduate:
Mr. McGuire: I want to say one word to you. Just one word.
Benjamin: Yes, sir.
Mr. McGuire: Are you listening?
Benjamin: Yes, I am.
Mr. McGuire: Plastics.
Benjamin: Exactly how do you mean?
Mr. McGuire: There’s a great future in plastics. Think about it. Will you think about it?
Cross out the word “plastics,” and substitute “artificial intelligence.” If the 1967 movie The Graduate were re-made today, that is what Mr. McGuire’s unsolicited investment advice would be. In this month’s commentary, we focus on asset class performance during the first half of the year and show that equity market performance has been concentrated in a very small number of companies and industries that are potential beneficiaries in the rapid growth of artificial intelligence.
June 2023, Second Quarter and Year-to-Date Market Performance
June total returns were largely impacted by exposure to interest rates (see Exhibit 1). Asset classes with equity and credit risk performed comparatively well, while US Treasurys, inflation-protected securities, and US agency mortgage-backed securities traded off, negatively affected by rate increases along the yield curve. Breakeven inflation expectations – a measure that can be thought of as the future inflation rate implied by current market pricing – rose, which is one of the factors that helps explain the positive performance of corporate bonds, bank loans, and equities.
Exhibit 1. 2023 Monthly Total Returns by Major Asset Class
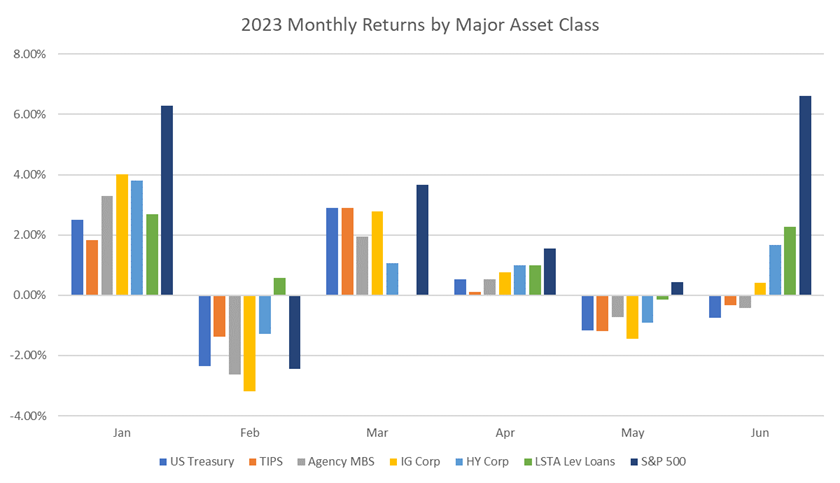
Source: Bloomberg, AAFMAA Wealth Management & Trust
For example, the five-year breakeven inflation rate rose by about 0.09% during June, which would correlate historically with a tightening in high yield spreads of about 0.22% (see Exhibit 2). Likewise, the 10-year breakeven inflation rate rose by about 0.06%, which would similarly be associated with a tightening in investment grade spreads of about 0.05%. Spread is the additional yield offered by a corporate bond over that of a US Treasury note with a similar maturity date; it is the compensation investors earn for taking credit risk. All else equal, when the spread of a bond declines, its price goes up. Because investment-grade bonds tend to have longer maturities than high-yield bonds, it is appropriate to use a longer measure of inflation expectations for investment grade than for high yield.
Exhibit 2. Monthly Change in High Yield Spread vs. Change in Breakeven Inflation Rate, 2002-2019
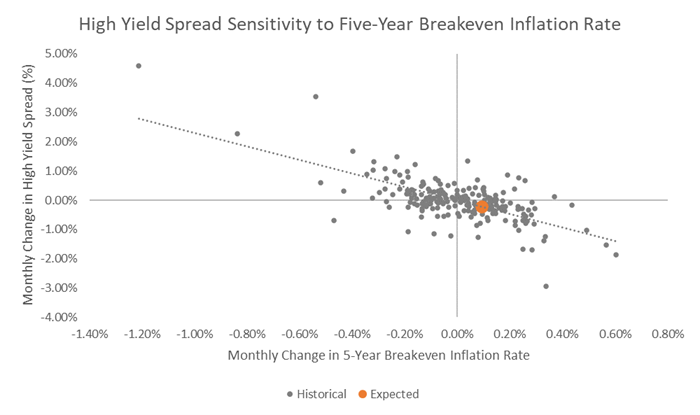
Source: Bloomberg, AAFMAA Wealth Management & Trust
Therefore, the increase in breakeven inflation rates likely helped push corporate bond spreads lower, which, in turn, helped generate positive price performance. And, in fact, high yield and investment grade corporate bond spreads did decrease by 0.69% and 0.15%, respectively. That’s directionally consistent with historical correlations but significantly more than would have been expected due to changes in inflation expectations alone.
The “excess” decline in spreads over what might have been expected reflects a reduction in risky asset volatility during each of June, the second quarter, and the first half. We’ll have more to say about that in a moment.
Second quarter total returns echo those of June, but investment grade returns were slightly negative (see Exhibit 3). Interest rates rose quite a bit over the quarter, bouncing back to higher levels following the prior flight to quality caused by the short-lived Silicon Valley Bank, Signature Bank, and First Republic Bank crisis. The increase in rates contributed to the relatively poor performance of asset classes with substantial rate exposure.
Exhibit 3. 2023 Quarterly Total Returns by Major Asset Class
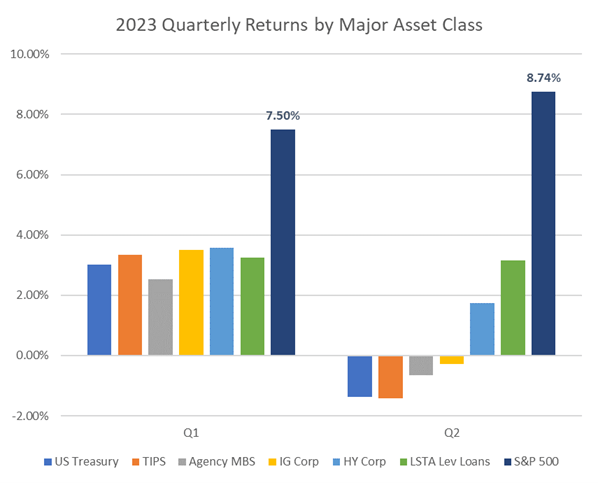
Source: Bloomberg, AAFMAA Wealth Management & Trust
For the entire first half, all major asset classes generated positive returns, at least partially recovering from disruptions caused by the Federal Reserve’s hawkish shift in 2022 (see Exhibit 4). Though the order of cumulative returns was consistent with what would be expected based on history (Equity return > High Yield return > Investment Grade return > Agency MBS return > US Treasury return), the absolute scale of the returns was not.
At 16.9%, the S&P 500 total return was in the 89th percentile of half-year returns from 1990 through today. In plainer language, the equity market had a great first half. The high yield return of 5.4% was in the 62nd percentile of half-year returns over the same period and therefore had a decent first half. However, investment-grade corporates, mortgage-backed securities, and Treasurys had average to below-average returns. This pattern reflects the impact of rising rates on interest-rate-sensitive asset classes.
Exhibit 4. 2023 First Half Cumulative Total Returns by Major Asset Class
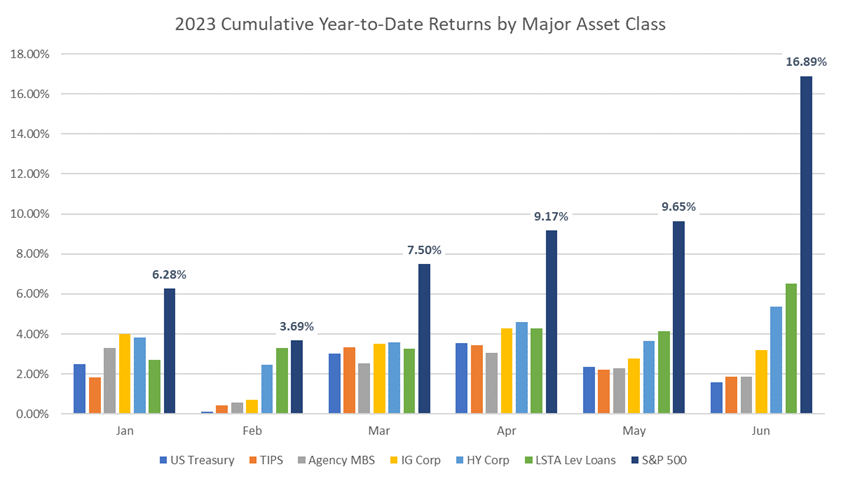
Source: Bloomberg, AAFMAA Wealth Management & Trust
The equity market’s outsized performance begs the question why, and how broadly representative were average market returns?
Let’s start with the point we made earlier: risky asset volatility generally declined over the course of the first half. By “risky asset,” we mean assets that primarily carry credit or equity risk compared with interest rate risk. Two good examples are stocks and high-yield bonds. While Treasury securities carry interest rate risk, we don’t consider them “risky” assets because their full principal and interest are guaranteed to be repaid by the US government.
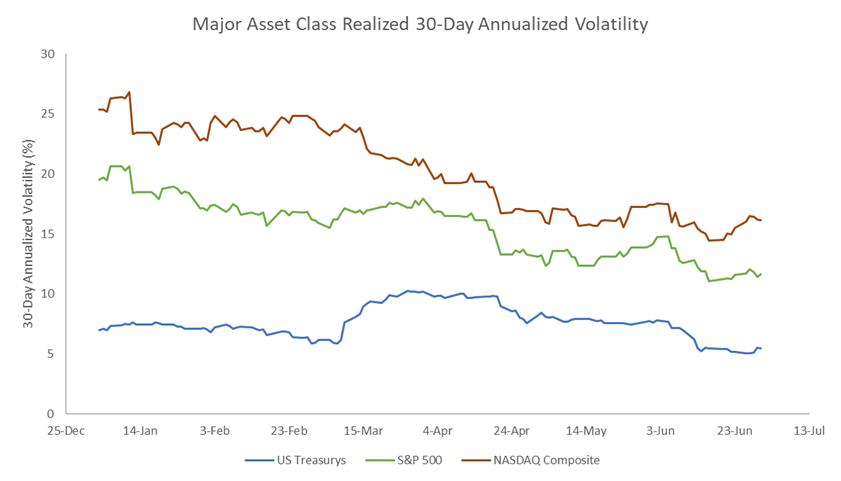
Exhibit 5 shows rolling 30-day annualized volatility of the S&P 500 and NASDAQ Composite Indices compared with rolling 30-day annualized volatility of US Treasurys for the first six months of the year. As a proxy for the Treasury market, we use the iShares US Treasury Bond ETF. As the highlighted area of the chart indicates, equity volatility declined significantly, though not uniformly. Given the S&P 500’s large exposure to Financials, its volatility rose briefly in March and April during the bank crisis, then resumed its downward trend. In contrast, the Nasdaq Composite, which has little direct exposure to Financials, performed well even during the crisis. US Treasury volatility ended the first half about where it started the year after roughly doubling during the bank disruptions.
Exhibit 5. Major Asset Class Realized Volatility
Source: Bloomberg, AAFMAA Wealth Management & Trust
So why is this important? By analogy, those of us of a certain age remember static on our TV sets (if you’re not of a certain age, you can Google it). At the time, rabbit-ear antennas received high-frequency broadcast TV signals over airwaves to produce audio and video. When the signals experienced interference, both the audio and video could suffer from white noise. Depending on the degree of that noise, a broadcast could be clear and audible, annoyingly snowy, or unwatchable.
Volatility is the white noise or static of the securities markets. When volatility is high, financial signals become harder to discern, obscuring valuations; when volatility is low, the financial landscape becomes clearer. Technically, volatility is a measure of the variance in returns. From a simpler perspective, volatility increases when uncertainty about the economic future rises and decreases when uncertainty diminishes.
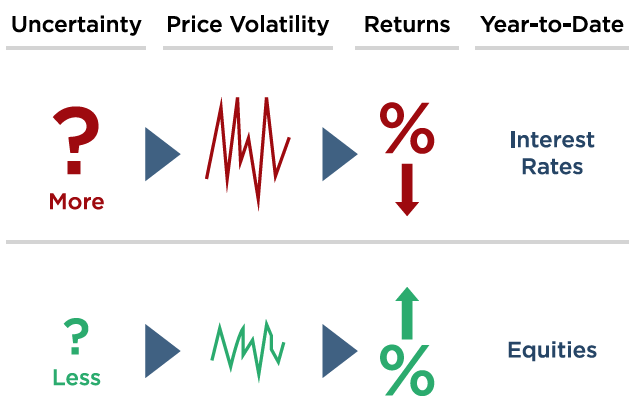
Exhibit 6 illustrates the process. As uncertainty increases, markets tend to experience more frequent and larger swings in prices; as uncertainty decreases, prices become more stable. It is well-documented that more frequent, larger swings in prices are negatively correlated with returns. As a result, when uncertainty rises, returns typically (though not always) go down; conversely, when uncertainty goes down, returns typically go up.
Uncertainty about interest rate hikes and Federal Reserve policy began 2023 at a high level and remained there, preventing interest rate volatility from declining. In fact, investors are still not sure whether the Fed will hike rates once or twice more this year. That uncertainty was likely the catalyst that caused US Treasurys to go down in price (and up in yield). It could also be cause for concern in the second half if inflation doesn’t continue to fall.
Exhibit 6. Why Tracking Volatility is Important
Source: Bloomberg, AAFMAA Wealth Management & Trust
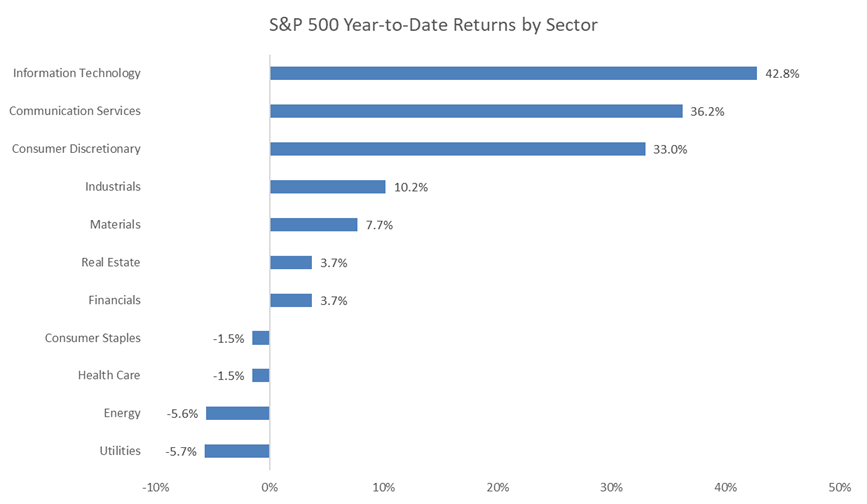
While equity volatility declined over the first half, the declines weren’t distributed evenly over all industry sectors, and, neither were total returns (see Exhibit 7). The top four performing sectors enjoyed outsized returns, while the remaining seven sectors experienced modest to negative performance. The Information Technology, Communication Services, and Consumer Discretionary sectors each generated average returns above 30%. Although they might appear to cover a broad swath of the economy, there was, and continues to be, a much more narrowly defined common theme underlying the strength of returns in those sectors.
Exhibit 7. US Large Cap Equity Year-to-Date Returns by Sector
Source: Bloomberg, AAFMAA Wealth Management & Trust
As Exhibit 8 demonstrates, a handful of industries within the three strongest sectors contributed approximately 87% of large-cap returns (based on the Bloomberg 500 Index): Software; Semiconductors; Technology Hardware, Storage and Peripherals; Interactive Media and Services; Broadline Retail; and Automobiles. Contribution of return takes into account the weighting of an industry or company in the index and its return. For each industry or company, the contribution tells us the dollars of return that came from that industry or company for every $100 of index return. That means that these six industries generated $87 out of every $100 of large-cap returns. There are 68 industry groups, which means that the other 62 industries only accounted for about $13 of every $100 returned by the large-cap stocks.
Exhibit 8. Year-to-Date US Large Cap Equity Contribution to Index Return by Industry
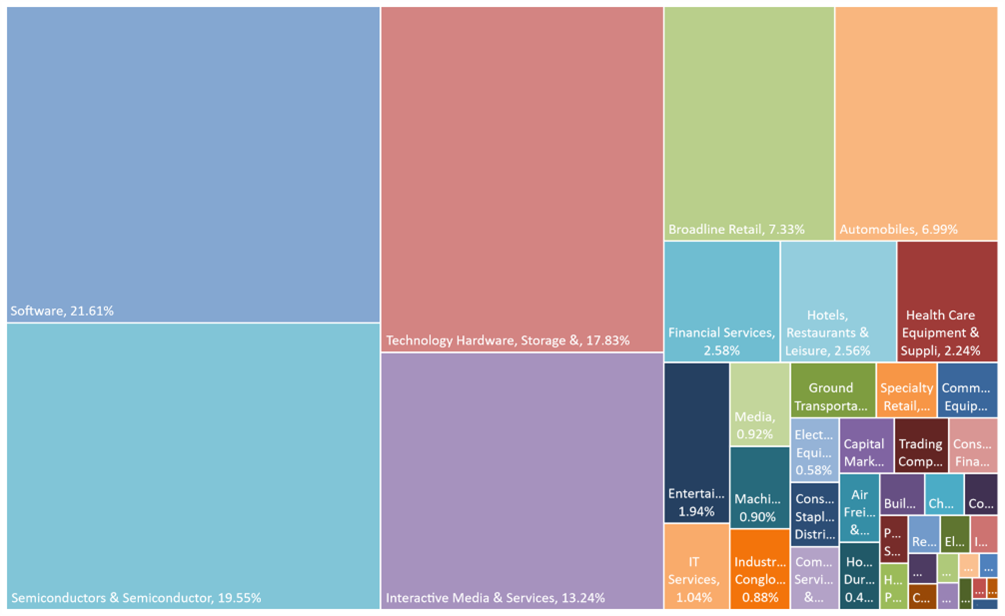
*Based on Bloomberg B500 Index / Source: Bloomberg, AAFMAA Wealth Management & Trust
Exhibit 9 takes a deeper look at individual company contributions to large-cap returns. Out of the 500 companies in the Bloomberg B500, ten contributed about 75% of the dollars of return. Excepting Eli Lilly, a pharmaceutical company, they all have a direct connection with advanced software design; computers, phones, and tablets; computer chips; social media; or online retailing. We would argue that the narrowly defined common theme uniting these companies’ strong returns is a belief that they will benefit from the explosion of interest in artificial intelligence and, specifically, in large language models like ChatGPT.
Exhibit 9. Year-to-Date US Large Cap Equity Contribution to Index Return by Company
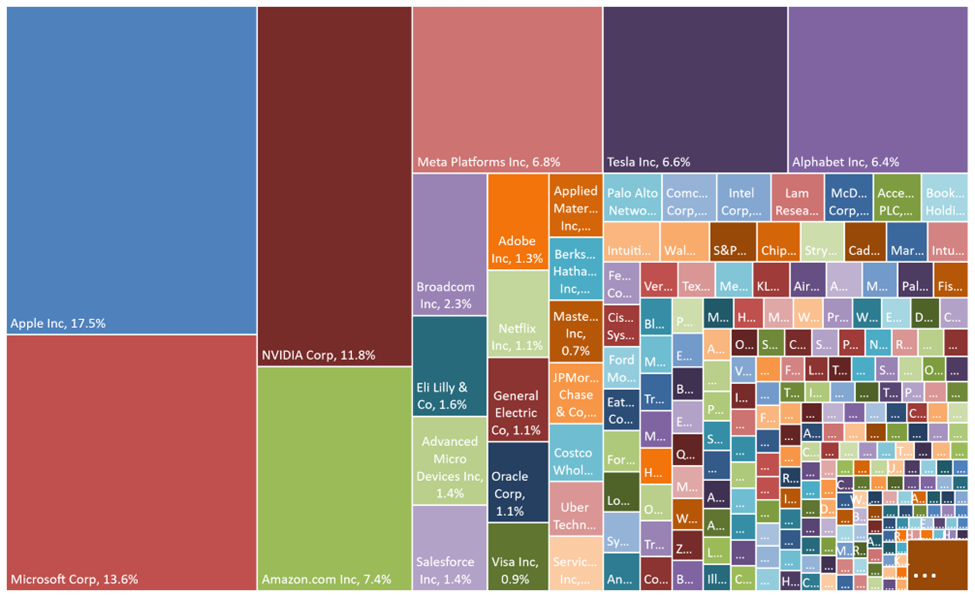
*Based on Bloomberg B500 Index / Source: Bloomberg, AAFMAA Wealth Management & Trust
That leads us to conclude that neither the decline in risky asset volatility nor the strong first-half average return of the equity market are broad endorsements of the attractiveness of credit and equity risk. The deeper message may be that it’s critical to distinguish between the excitement related to a set of AI technologies whose time has finally come and the modest to subpar contributions to return that most non-technology-related companies have been delivering. In prior commentaries and in many one-on-one conversations, we’ve discussed the bond market’s view that (1) inflation is likely to fall dramatically and (2) a recession is highly likely later this year. Reconciling the apparent optimism of the equity market with the pessimism of the bond market can only be accomplished in this context.
We are comfortable with our higher allocation to cash and correspondingly lower allocation to equities. We also believe that within the equity market, thematic stock selection will be quite important during the second half.
Yours in trust,
Paul Jablansky
Chief Investment Officer
Increase Your Financial Wellness with AWM&T
At AAFMAA Wealth Management & Trust LLC, we are committed to serving the unique financial needs of the military community. Whether you require a complimentary portfolio review, a comprehensive financial plan, assistance with your investment strategy, or trust services, our military wealth management professionals are ready to serve you. Contact us today to set up an appointment with a Relationship Manager who can assess your financial health and customize your personalized action plan.
About Us
Founded in 2012, AAFMAA Wealth Management & Trust LLC (AWM&T) was created to meet the distinct financial needs of military families. We proudly deliver experienced, trustworthy financial planning, investment management, and trust administration services – all designed to promote lasting security and independence.
We are proud to share the mission, vision, and values of Armed Forces Mutual, our parent company. We consistently build on the Association’s rich history and tradition to provide our Members with a source of compassion, trust, and protection. At AWM&T, we are committed to serving as your trusted fiduciary, always putting your best interests first. Through Armed Forces Mutual's legacy and our financial guidance, we provide personalized wealth management solutions to military families across generations.
© 2023 AAFMAA Wealth Management & Trust LLC. Information provided by AAFMAA Wealth Management & Trust LLC is not intended to be tax or legal advice. Nothing contained in this communication should be interpreted as such. We encourage you to seek guidance from your tax or legal advisor. Past performance does not guarantee future results. Investments are not FDIC or SIPC insured, are not deposits, nor are they insured by, issued by, or guaranteed by obligations of any government agency or any bank, and they involve risk including possible loss of principal.
Get In Touch!
Schedule a consultation with one of our expert financial planners today, and let's hit the fast-track to success!
Schedule A ConsultationRelated posts
June 2023 Market Commentary
Read more
May 2023 Market Commentary
Read more