


November 2023 Commentary
October 2023 and Year-to-Date Market Performance
October returns were almost uniformly negative across asset classes (see Exhibit 1). The S&P 500 lost 2.1%, taking its year-to-date performance through October down to 10.7%. In contrast, at the end of July, the S&P 500 had been up by 20.7%. For the three-month period from July through October, the S&P 500 sustained a cumulative drop of 8.3%, not quite taking the index into bear-market territory but certainly coming close.
With the exception of floating-rate bank loan returns, October fixed income performance was also negative. Some small part of the negative sentiment may have related to the outbreak of the war between Israel and Hamas, but the primary driver was uncertainty over Federal Reserve policy and the future path of interest rates. While investors finally seemed to accept the premise that the Fed would keep rates high for an extended period, both intraday and daily interest rate volatility were elevated, causing significant swings in Treasury and corporate bond prices.
During the first half of November, sentiment reversed wildly. Through November 17th, the S&P rallied by 7.8%, Treasuries rallied by 2.6%, and investment-grade corporate bonds rallied by 4.3%.
Exhibit 1. 2023 Monthly and Year-to-Date Returns
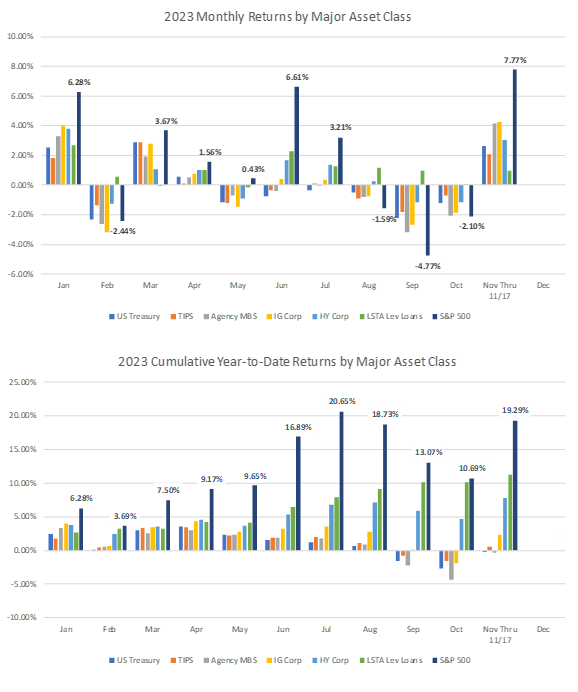
Source: Bloomberg, AAFMAA Wealth Management & Trust
Economic and Market Commentary
This month, we take a detour from the capital markets and comment briefly on the housing market. With the dramatic increase in interest rates over the past year and a half, mortgages have become a lot less affordable for prospective homebuyers. For example, the 30-year fixed mortgage rate reported weekly by the Mortgage Bankers Association rose from 3.33% at the beginning of 2022 to 7.53% at the end of September. According to the National Association of Realtors (NAR), median house prices at the beginning of 2022 and at the end of September 2023 were $359 thousand and $394 thousand, respectively. Assuming mortgage interest rates of 3.33% and 7.53%, the mortgage payments for the median house at the beginning of 2022 and in September 2023 would have been $1,577 per month and $2,765 per month, respectively. Therefore, the cost (in terms of monthly payment) to buy the median-priced house would have increased over the period by $1,188 per month to a level that is 75% higher.
And yet, even with that increase in the cost of mortgages, house prices today are — counterintuitively — more than 15% higher than they were at the beginning of 2022 (based on data from the Federal Housing Finance Agency). What does that mean for the housing market over the next year or two?
To answer that question, we need to identify factors that influence house prices. It shouldn’t be surprising that home affordability is important. In addition, there are at least two other significant factors: the level of unemployment and the inventory of houses for sale. Home affordability and unemployment are primarily demand factors; inventory is a supply factor. There are undoubtedly a large number of other less significant economic factors that also come into play.
Home affordability is defined by the NAR as an index that “measures the degree to which a typical family can afford the monthly payments on a typical home.” To determine affordability, the NAR calculates the “qualifying” income a family would need to be approved for a mortgage with a monthly payment based on the median price of an existing single-family home and the average mortgage rate for a 30-year mortgage. The NAR assumes that the prospective home purchaser makes a downpayment of 20% of the purchase price and spends no more than 25% of their monthly income on their mortgage payment. The NAR then takes the ratio of actual US median family income to the “qualifying” income and multiplies it by 100. If the median income is equal to the “qualifying” income, then the affordability index is equal to 100. If the median income is higher than the “qualifying” income, then the index is higher than 100; likewise, if the median income is lower than the “qualifying” income, the index is lower than 100 (see Exhibit 2).
Exhibit 2. Home Affordability, March 1986 to September 2023
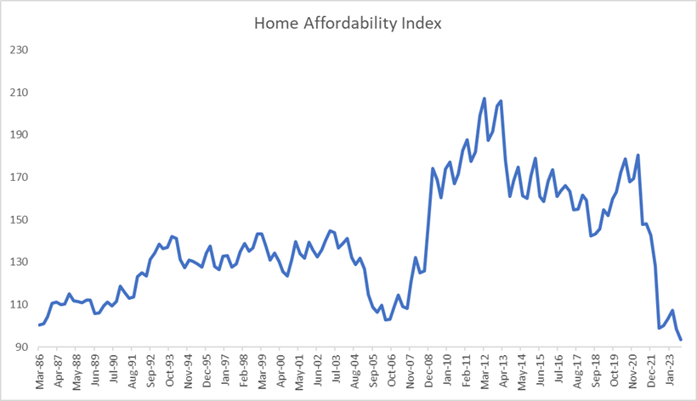
Source: Bloomberg, National Association of Realtors, AAFMAA Wealth Management & Trust
Over the last 35 years or so, the annual percentage change in house prices has been closely related to the annual percentage change in affordability. Simple enough: people buy more houses when they’re affordable and fewer houses when they’re not. But when we break down affordability into its inputs, we see that the change in house prices actually depends on changes in median income, changes in mortgage rates, and the existing level of house prices. Changes in median income are related to wage growth, which may reflect changes in productivity and the competitiveness of the employment market.
The relationships are quite complex, and, as we’ve seen, they can be counterintuitive. It's not correct, for example, to conclude that when mortgage rates go up, house prices will go down. That is one possible outcome, but there are others: if mortgage rates go up because inflation is high and the economy is expanding, then median income might go up by more than enough to compensate for the extra cost of higher monthly payments. In addition, the same change in mortgage rates at one time may not have the same impact at another time if income and price levels are different.
As Exhibit 2 shows, home affordability is currently the lowest that it’s ever been. That’s not a great sign. In isolation, it suggests that home prices might need to fall. As a mitigant, however, while wage growth has been decelerating, it’s still increasing, suggesting that median income can continue to grow. That’s a positive. On balance, though, we believe that housing demand will likely fall, but that doesn’t mean that home prices have to fall; they can increase less quickly.
Currently, inventory is above average. Housing inventory is estimated by NAR and expressed in terms of months of supply, which is defined as “the number of months it would take for the current inventory of homes on the market to sell given the current sales pace.” Today there are 6.9 months of supply. The long-term average is about 6.1. The lowest-ever inventory occurred in August 2020, when months of supply dropped to 3.3 during Covid. The highest-ever level, 12.2, occurred at the beginning of 2009 during the Great Financial Crisis.
If mortgage rates stay high, which seems likely through at least the middle of 2024, then we would expect the propensity of homeowners to sell houses to drop. If that happens, we would expect months of supply to decline, which would help support house prices. We do anticipate that supply will likely decline. We therefore expect that both housing demand and housing supply will fall, at least partially offsetting each other.
Since the late 1980s, home prices have increased on average by about 4.3% annually. Over the same period, CPI inflation averaged about 2.8% per year, implying that the real increase in home prices was about 1.5% per year. More recently, from 2018 through 2022, home prices and CPI increased by about 9.2% per year and 3.8% per year, respectively, implying a much larger average annual real increase in home prices. That growth rate is not sustainable. As CPI trends toward the Fed’s stated goal of 2%, we believe that home price appreciation will converge back to its long-term average. That means that the rate at which house prices increase will likely go down, but it does not mean that house prices have to decline.
Media coverage of the housing market can be quite sensational and alarming. We have a more sanguine view.
Yours in Trust,
Paul
Increase Your Financial Wellness with AWM&T
At AAFMAA Wealth Management & Trust LLC, we are committed to serving the unique financial needs of the military community. Whether you require a complimentary portfolio review, a comprehensive financial plan, assistance with your investment strategy, or trust services, our military wealth management professionals are ready to serve you. Contact us today to set up an appointment with a Relationship Manager who can assess your financial health and customize your personalized action plan.
About Us
Founded in 2012, AAFMAA Wealth Management & Trust LLC (AWM&T) was created to meet the distinct financial needs of military families. We proudly deliver experienced, trustworthy financial planning, investment management, and trust administration services – all designed to promote lasting security and independence.
We are proud to share the mission, vision, and values of Armed Forces Mutual, our parent company. We consistently build on the Association’s rich history and tradition to provide our Members with a source of compassion, trust, and protection. At AWM&T, we are committed to serving as your trusted fiduciary, always putting your best interests first. Through Armed Forces Mutual's legacy and our financial guidance, we provide personalized wealth management solutions to military families across generations.
© 2023 AAFMAA Wealth Management & Trust LLC. Information provided by AAFMAA Wealth Management & Trust LLC is not intended to be tax or legal advice. Nothing contained in this communication should be interpreted as such. We encourage you to seek guidance from your tax or legal advisor. Past performance does not guarantee future results. Investments are not FDIC or SIPC insured, are not deposits, nor are they insured by, issued by, or guaranteed by obligations of any government agency or any bank, and they involve risk including possible loss of principal.
Get In Touch!
Schedule a consultation with one of our expert financial planners today, and let's hit the fast-track to success!
Schedule A ConsultationRelated posts

May 2023 Market Commentary
Read more
October 2023 Market Commentary
Read more