

May 2025 Commentary
As we all know, the financial markets have been on a rollercoaster recently. Realized equity market volatility hit its highest level since Covid following the April 2nd tariffs announcement. Daily returns have been as low as -6.0% on April 4th and as high as 9.5% on April 9th. Those are year-sized moves that each occurred in the span of a single trading day. As a result, uncertainty is playing an outsized role in the course of portfolio management. We responded in mid April by (1) modestly reducing risk in both our equity and fixed income models, and (2) diversifying a small slice of our equity models into non-US developed market exposures.
In this month’s commentary, we take a snapshot of cross-sector market risk implied by options pricing. While that sounds complicated, it’s really just a matter of recognizing that the valuations investors make today in the options market provide insight into the upside and downside returns collectively expected across market sectors. Here is an example of what we’re talking about:
On Friday, May 9th, the price of SPDR S&P 500 ETF Trust (SPY) was about $564. SPY is an exchange-traded fund that replicates the return of the S&P 500. Because it has tradeable options, investors can pay a premium (i.e., a fee) for the right – but not the obligation – to buy or sell the fund at a given price on any day up to and including a particular date. The right to buy or sell the fund is called an option. The given price is called the strike price, and the particular date is called the expiration date. The right to buy is referred to as a call option, and the right to sell is referred to as a put option.
One of the expiration dates was July 18, 2025. Exhibit 1 shows the call and put option prices for each strike price on that expiration date as of May 9, 2025. To understand the chart, let’s analyze one call and one put option. The market price of an option to buy SPY at $580 per share on July 18, 2025, was about $12 per share. As a result, as long as the price of SPY increased to at least $592 on or before July 18, 2025, an investor in that option would make money by buying SPY (at the $580 per share strike price) and simultaneously selling it at the market price. The difference between $592 and $580 represents the $12 per share cost of the option. In reality, there would likely be a small amount of additional trading costs. If the price of SPY did not increase to at least $592, then the investor would lose money on the options trade. The $12 per share increase in price on a starting level of $564 equates to a minimum 2.1% required return on SPY before that particular call option trade breaks even.
Similarly, the market price of an option to sell SPY at $548 per share on July 18, 2025, would have been approximately $13 per share. Therefore, as long as the price of SPY decreased to at least $535 on or before July 18, 2025, an investor in that option would make money by selling SPY (at the $548 per share strike price) and simultaneously buying it at the market price. The difference between $548 and $535 represents the cost of the put option. Again, there would likely be a small amount of additional trading costs. If the price of SPY did not decrease to at least $535, then the investor would lose money on the trade. The maximum realized return on SPY for the put option trade to be profitable would be -2.3%.
Notice that even though the call and put strike prices are the same distance from the current market price of $564, the cost of the put option ($13 per share) is higher than the cost of the call option ($12 per share). This phenomenon relates to the difference in the way investors view the risk of gains and losses.
Exhibit 1. Call and Put Option Prices for SPY on May 9, 2025
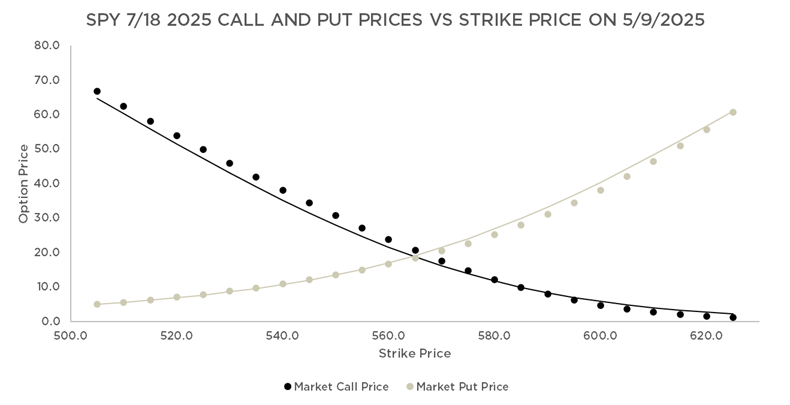
Source: Bloomberg, AAFMAA Wealth Management & Trust
Our intent in describing the put and call is not to provide a primer on options, but rather to make the point that the pattern of call and put prices on any date provides insight into investors’ collective expectations about future returns. In fact, we can use the call and put prices to construct an implied distribution of returns for SPY for the period from the current date to the expiration date. Exhibit 2 not only shows this distribution for the July 18, 2025 expiration, but also demonstrates that, like call and put prices, implied returns are not symmetric. In the case of SPY, the left tail is longer than the right tail, suggesting that investors expect more potential downside than upside.
To more formally quantify the asymmetry in returns, we define the ratio of upside to downside return as the average implied gain in the top 10% of distribution returns (the “upside”) divided by the average implied loss in the bottom 10% of distribution returns (the “downside”). For SPY, on May 9, 2025, the implied return distribution through the July 18, 2025 expiration had an upside to downside return ratio of 0.93 based on 16.0% upside and 17.3% downside. The interpretation is that investors collectively expected the S&P 500 to have roughly 7% more downside risk than upside potential.
Exhibit 2. SPY Implied Return Distribution Through The July 18, 2025 Expiration As Of May 9, 2025

*This is the “risk-neutral” return distribution, which discounts future prices at the risk-free rate.
Source: Bloomberg, AAFMAA Wealth Management & Trust
To get a broader sense of market expectations, we perform a similar analysis on six additional passive ETFs representing market sectors that are directly relevant or, perhaps, simply of interest to wealth management clients. Exhibit 3 lists these ETFs along with the market sectors they replicate. We continue to focus on the July 18, 2025 expiration. This approximately two-month timeframe works well for rebalancing horizons, and two-month option implied return distributions have been shown to represent future risk well.
Exhibit 3. Market Sector Representative Funds
|
Fund Name |
Ticker |
Market Sector |
Asset Class |
|
SPDR S&P 500 ETF Trust |
SPY |
S&P 500 |
Equity |
|
iShares MSCI EAFE ETF |
EFA |
Developed country equities across the world excluding the U.S. and Canada |
Equity |
|
iShares MSCI Emerging Markets ETF |
EEM |
Emerging market stocks that can predominantly be classified as large and mid-cap |
Equity |
|
iShares 3-7 Year Treasury Bond ETF |
IEI |
U.S. Treasury bonds with remaining maturities between three and seven years |
Fixed Income |
|
iShares iBoxx $ Investment Grade Corporate Bond ETF |
LQD |
U.S. dollar-denominated, investment-grade corporate bonds |
Fixed Income |
|
iShares iBoxx $ High Yield Corporate Bond ETF |
HYG |
U.S. dollar-denominated, high yield corporate bonds |
Fixed Income |
|
SPDR Gold Shares |
GLD |
Gold |
Commodity |
Source: Bloomberg, AAFMAA Wealth Management & Trust
When constructing the implied return distribution, we can fit two volatilities, one representing upside risk and the other representing downside risk. Upside volatility is a measure of how “good” the returns might be, and, conversely, downside volatility is a measure of how “bad” they might be. The fact that the volatilities can be different explains in part why the return distributions might not be symmetric. While upside risk may be of some interest, there is a school of thought, which we agree with, that portfolio risk analysis should focus on downside volatility rather than upside volatility.
In Exhibit 4, we plot the upside to downside return ratios of each of the representative market sectors compared with their downside volatilities. The results cluster into two groups delineated by the rectangles on the chart. The rectangle on the left encompasses the fixed income sectors, while the rectangle on the right encompasses equity and gold. The conclusion from this analysis is that fixed income assets are currently more efficient under this framework because they offer higher levels of upside to downside at lower levels of risk.
Exhibit 4. Upside to Downside Return Ratios Per Unit of Downside Risk of Representative Asset Classes, Based on July 18, 2025 Option Expirations as of May 9, 2025

*Based on option implied “risk-neutral” return distributions, which discount future prices at the risk-free rate.
Source: Bloomberg, AAFMAA Wealth Management & Trust
However, from a portfolio construction perspective, that doesn’t imply that investors’ assets should be concentrated in fixed income. What this analysis leaves out is a measure of expected return, which history and theory suggest would be proportional to downside volatility. For example, higher potential equity returns come at the expense of lower levels of efficiency. Likewise, higher upside to downside return ratios of fixed income may come at the cost of lower absolute returns.
What the analysis does tell us is that, within asset classes, over the next couple of months, certain combinations of assets might be expected to generate better performance than others. Within fixed income, a combination of US Treasuries and high yield might be attractive relative to investment-grade corporates. Within equities, a combination of non-US developed market equity and the S&P 500 might provide better value than the S&P 500 alone. Interestingly, gold, which is largely uncorrelated with equities, might be an attractive diversifier.
As always, there are important considerations when we look at short-term relative value. First, we invest primarily for the long term. We therefore determine whether short-term trading opportunities make sense based not only on current relative value, but also on tax and turnover implications. Second, when markets are as volatile as they have been, the half-life of an opportunity may be too short to take advantage of. In that respect, it’s possible that by the time of publication, the specific conclusions that we’ve discussed could be outdated.
When we reduced risk in mid-April, we were focused on the market implications of tariff policy changes, including those that could potentially disadvantage US companies compared with international competitors. We were also concerned with uncertainty in the objective, roll-out, and timing of the new tariff paradigm. Our forecast for inflation and unemployment over the next 12 months increased, and our forecast for economic growth decreased. Within our equity portfolios, we added a 10% exposure to non-US developed market equities to diversify tariff-related risk. We also reduced exposure to companies that we believe are directly negatively impacted by tariffs and that have greater economic cyclicality to an economic downturn. Within fixed income, we lowered credit risk by reducing our allocation to corporates and increasing our exposure to US Treasuries and agency mortgage-backed securities.
The new administration seems to be converging toward stable tariff levels with major trading partners, so far including productive discussions with the UK and China. We expect volatility to ebb and flow with updated announcements. Our view is that our more defensive posture remains prudent. We’ll continue to navigate through these volatile markets as well as possible.
We hope you are enjoying a beautiful Spring and would always love to hear your thoughts.
Yours in Trust,
Paul
Secure Your Financial Future with AWM&T
At AAFMAA Wealth Management & Trust LLC, we are committed to serving the unique financial needs of the military community. Whether you require a complimentary portfolio review, a comprehensive financial plan, assistance with your investment strategy, or trust services, our military wealth management professionals are ready to serve you. Contact us today to set up an appointment with a Relationship Manager who can assess your financial health and customize your personalized action plan.
About Us
Founded in 2012, AAFMAA Wealth Management & Trust LLC (AWM&T) was created to meet the distinct financial needs of military families. We proudly deliver experienced, trustworthy financial planning, investment management, and trust administration services – all designed to promote lasting security and independence.
We are proud to share the mission, vision, and values of Armed Forces Mutual, our parent company. We consistently build on the Association’s rich history and tradition to provide our Members with a source of compassion, trust, and protection. At AWM&T, we are committed to serving as your trusted fiduciary, always putting your best interests first. Through Armed Forces Mutual's legacy and our financial guidance, we provide personalized wealth management solutions to military families across generations.
© 2025 AAFMAA Wealth Management & Trust LLC. Information provided by AAFMAA Wealth Management & Trust LLC is not intended to be tax or legal advice. Nothing contained in this communication should be interpreted as such. We encourage you to seek guidance from your tax or legal advisor. Past performance does not guarantee future results. Investments are not FDIC or SIPC insured, are not deposits, nor are they insured by, issued by, or guaranteed by obligations of any government agency or any bank, and they involve risk including possible loss of principal. No information provided herein is intended as personal investment advice or financial recommendation and should not be interpreted as such. The information provided reflects the general views of AAFMAA Wealth Management and Trust LLC but may not reflect client recommendations, investment strategies, or performance. Current and future financial environments may not reflect those illustrated here. Views of AAFMAA Wealth Management & Trust LLC may change based on new information or considerations.
Get In Touch!
Schedule a consultation with one of our expert financial planners today, and let's hit the fast-track to success!
Schedule A ConsultationRelated posts
May 2026 Market Commentary
Read more
May 2023 Market Commentary
Read more