


August 2023 Market Commentary
July 2023 and Year-to-Date Market Performance
July returns were mostly unremarkable. Year-to-date returns continue to be strong. The S&P 500, for example, was up 20.65% through the end of July (see Exhibit 1).
Exhibit 1. 2023 Monthly and Year-to-Date Returns
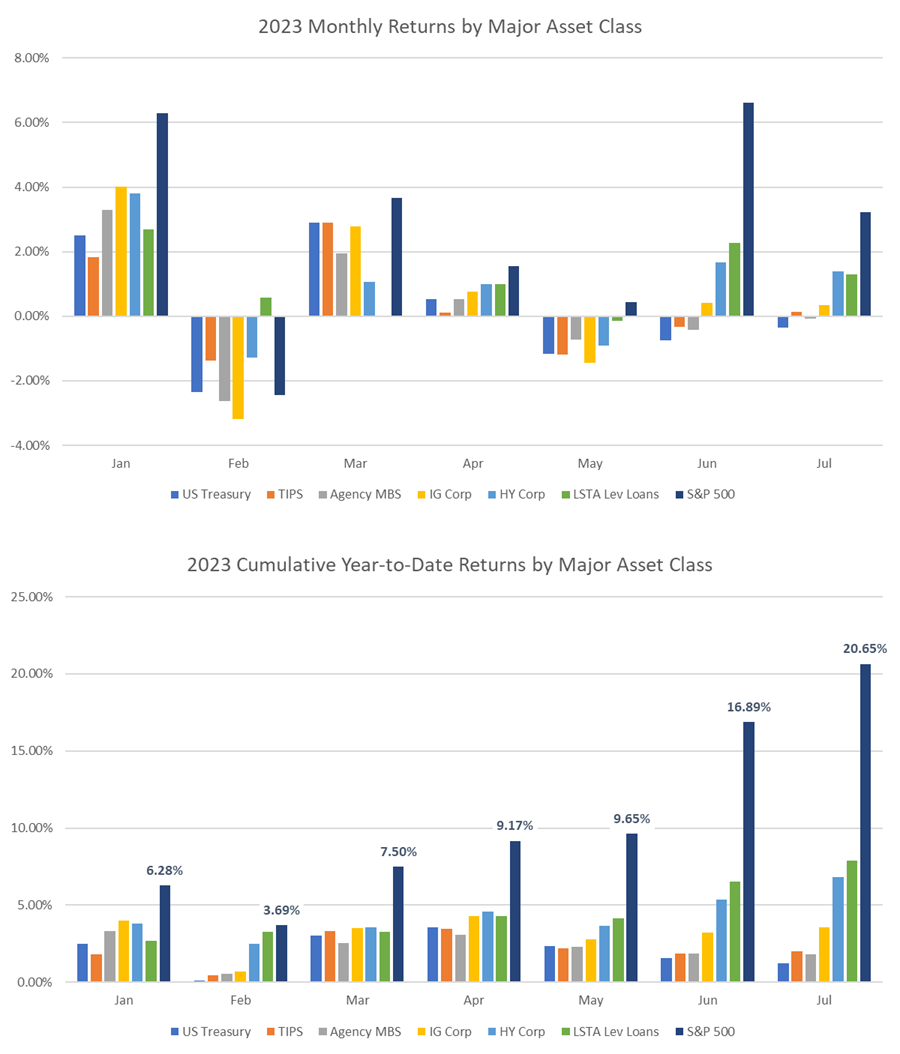
Source: Bloomberg, AAFMAA Wealth Management & Trust
Economic and Market Commentary
Our job as professional wealth managers is to invest for the long term, not to speculate on short-term events. But that should not prevent us from analyzing patterns that may help put realized and potential future returns in perspective. Given the kickoff of the 2024 campaign season, we thought it would be timely to explore historical market returns and the US presidential election cycle. We break down the four-year cycle into pre-election, election, post-election, and mid-term years. Using annual data from 1975 through 2022, we conclude that pre-election years tend to enjoy strong equity returns compared with election, post-election, and mid-term years, especially when the pre-election year follows a negative mid-term year. We also confirm that US Treasuries and Investment Grade Corporate Bonds tend to perform much more consistently across the cycle, a result that we would expect given the lower-return, lower-risk nature of investment grade fixed income assets. Average returns across each of the asset classes have been similar in mid-term years with fixed-income average returns slightly exceeding those of equities.
There have been 12 election cycles since 1975, spanning seven recessions, six Democratic presidential wins, and six Republican presidential wins. Exhibit 2 shows the distribution of annual US Treasury, US Investment Grade Corporate Bond, and S&P 500 Index returns over the period. Years with positive returns dominate. For example, the S&P 500 Index experienced 39 years of positive returns compared with nine years of negative returns. Treasuries and Investment Grade Corporates experienced 42 and 38 positive years, respectively.
Average single-year returns were 6.6%, 7.4%, and 12.0% for Treasuries, Investment Grade Corporates, and the S&P 500, respectively.
Exhibit 2. Annual Asset Class Returns, 1975 - 2022
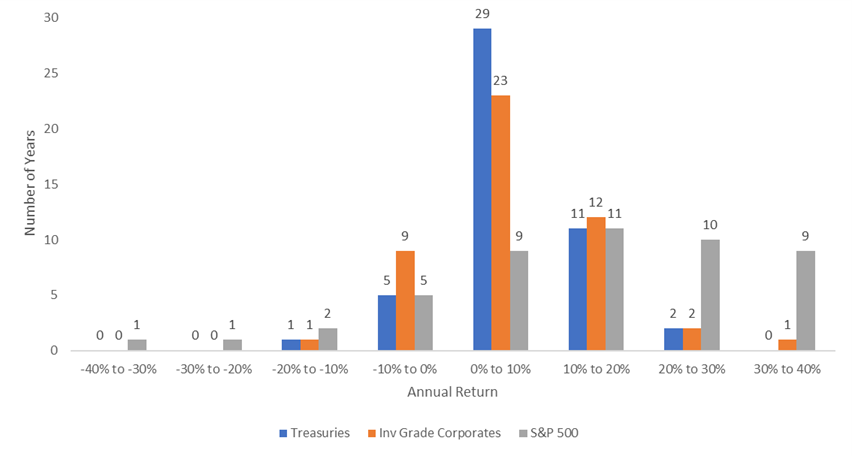
*US Treasury returns are based on the Bloomberg US Treasury Total Return Index. Investment Grade Corporates are based on the Bloomberg US Corporate Total Return Index. Source: Bloomberg, AAFMAA Wealth Management & Trust
Exhibit 3 breaks out average returns by asset class by year of cycle. As we mentioned earlier, two trends are evident: (1) the S&P 500 tends to perform relatively well in pre-election years and substantially less well in mid-term years; and (2) Treasuries and Investment Grade Corporates provide lower but far more consistent returns. Interestingly, on average, the two fixed-income asset classes have slightly out-performed equities during mid-term years.
The natural question to ask is why these patterns exist. Given that we’re not political scientists, we limit ourselves to two observations: first, presidential administrations would appear to have an incentive to facilitate strong market returns leading into election years; and second, the party that controls the White House tends to lose seats in Congress during mid-term elections. It’s not clear what the nature of the causality is for the second observation, but a correlation between the loss of presidential party votes in Congress and lower asset returns makes sense to us: we believe it’s equally plausible (i) that mid-term political uncertainty can lead to financial uncertainty and poor returns, and that (ii), cyclically poor returns could lead voters to punish presidential administrations by reducing their power in Congress. There are obviously many other factors that have an impact on returns, including central bank monetary policy, the strength of the global economy, geopolitical tensions, and the ready availability of natural resources.
Exhibit 3. Average Asset Class Returns by Year of Election Cycle, 1975 - 2022
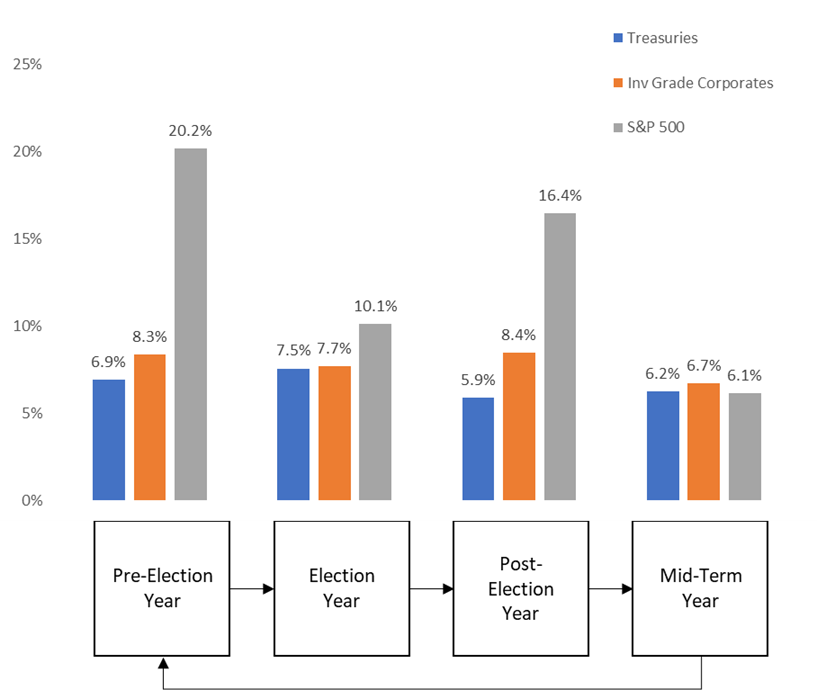
*US Treasury returns are based on the Bloomberg US Treasury Total Return Index. Investment Grade Corporates are based on the Bloomberg US Corporate Total Return Index. Source: Bloomberg, AAFMAA Wealth Management & Trust
There is one more point we’d like to make. In general, annual equity returns are not mean-reverting. However, pre-election year equity returns do appear to be. Since 1971, about 43% of the variation in pre-election year S&P 500 returns can be explained by the previous year’s return. We know from the diagram above that the year prior to a pre-election year is a mid-term year. That means that the lower a mid-term year return is, the higher the following pre-election year return is likely to be (see Exhibit 4).
As it turns out, 2023 is a pre-election year following a mid-term year – 2022 -- with a large negative return. One of the themes we’ve discussed in recent commentaries is the surprisingly strong year-to-date performance that equities have generated despite a hawkish Federal Reserve and a high statistical probability of recession.
Here’s where things get interesting. Given last year’s -18.1% S&P 500 return, based solely on the historical relationship in Exhibit 3, we would forecast 2023’s full-year return to exceed 30%. The 20.65% year-to-date return through July would be right on pace to achieve that.
Exhibit 4. Pre-Election Year S&P 500 Returns Compared with Prior Mid-Term Year Return
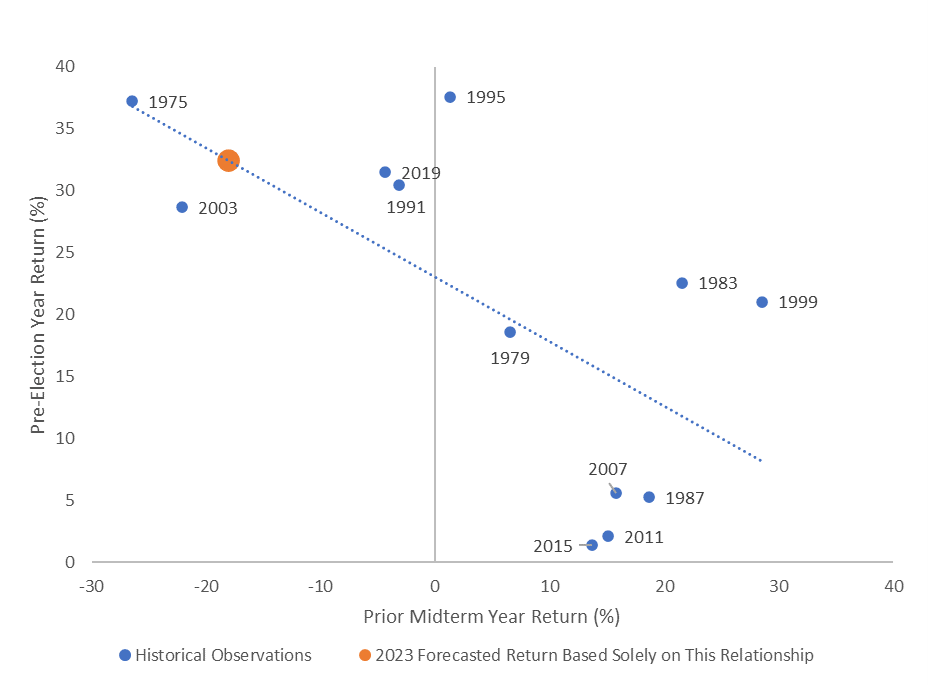
Source: Bloomberg, AAFMAA Wealth Management & Trust
This relationship may indeed provide some context for this year’s better than expected equity performance. If that is the case, then we might wonder if fiscal policy did, in fact, have anything to do with the strength of the returns, and what the implications might be for 2024 and beyond. Our thematic forecast has been for a negative second half in equities based on our view that the Fed is unlikely to manage a soft landing. We continue to have that view, which means that we believe that the full-year 2023 S&P 500 return is likely to be closer to 10% than 30%, fully acknowledging that there is a broad diversity of opinion on this topic.
We also reiterate that the highest fixed-income yields since the Great Financial Crisis make Treasuries and corporate bonds as attractive as they’ve been in years. Our somewhat reduced allocation to equities and increased allocation to cash remains consistent with our outlook.
Yours in trust,
Paul Jablansky
Chief Investment Officer
Increase Your Financial Readiness with AWM&T
At AAFMAA Wealth Management & Trust LLC, we are committed to serving the unique financial needs of the military community. Whether you require a complimentary portfolio review, a comprehensive financial plan, assistance with your investment strategy, or trust services, our military wealth management professionals are ready to serve you. Contact us today to set up an appointment with a Relationship Manager who can assess your financial health and customize your personalized action plan.
About Us
Founded in 2012, AAFMAA Wealth Management & Trust LLC (AWM&T) was created to meet the distinct financial needs of military families. We proudly deliver experienced, trustworthy financial planning, investment management, and trust administration services – all designed to promote lasting security and independence.
We are proud to share the mission, vision, and values of Armed Forces Mutual, our parent company. We consistently build on the Association’s rich history and tradition to provide our Members with a source of compassion, trust, and protection. At AWM&T, we are committed to serving as your trusted fiduciary, always putting your best interests first. Through Armed Forces Mutual's legacy and our financial guidance, we provide personalized wealth management solutions to military families across generations.
© 2023 AAFMAA Wealth Management & Trust LLC. Information provided by AAFMAA Wealth Management & Trust LLC is not intended to be tax or legal advice. Nothing contained in this communication should be interpreted as such. We encourage you to seek guidance from your tax or legal advisor. Past performance does not guarantee future results. Investments are not FDIC or SIPC insured, are not deposits, nor are they insured by, issued by, or guaranteed by obligations of any government agency or any bank, and they involve risk including possible loss of principal.
Get In Touch!
Schedule a consultation with one of our expert financial planners today, and let's hit the fast-track to success!
Schedule A ConsultationRelated posts
May 2023 Market Commentary
Read more
October 2023 Market Commentary
Read more