Menu
Menu







Investing with Better Intelligence: What the Options Market Can Tell Us
Military decisions are rarely made using a single source of information. A commander can observe the forces immediately in front of them, but that view alone is incomplete. Aerial surveillance may reveal activity beyond the visible horizon. Signals intelligence may identify concentrations or intentions that cannot be seen from the ground. Satellite imagery, radar, logistics reports, and other intelligence sources can each add a different piece to the operating picture.
None of these sources eliminates uncertainty. Their value is that, taken together, they allow decision-makers to understand the environment more completely and position their forces more effectively. We believe investing works much the same way.
Traditional investment analysis provides a great deal of useful information. Current stock prices tell us where buyers and sellers have reached agreement today. Corporate earnings, economic data, interest rates, valuations, and historical market relationships provide additional perspectives. But there is another source of information that we believe is particularly valuable and often underused: the options market.
Information derived from options prices is one of the inputs we use in constructing portfolios. We are not trying to predict precisely where the stock market will be over some horizon. Instead, we use options prices to learn something about how the market is currently pricing a range of possible future outcomes. In military terms, we view the options market as another intelligence sensor – one that provides critical information in helping us construct portfolios that can keep up with the market in good times, perform less negatively in downturns, and potentially outperform in strongly positive periods.
Why Another Source of Intelligence Matters
The value of additional intelligence becomes particularly apparent when the environment changes rapidly. The conflict involving Iran provides an example. One of its most important economic consequences has been the disruption of global oil supplies and the resulting increase in crude oil prices. That change has affected more than energy companies. Higher energy costs can influence inflation, consumer purchasing power, corporate profit margins, interest-rate expectations, and ultimately equity valuations.
The relationship between oil and the stock market has consequently looked very different since the conflict began. As Exhibit 1 shows, the S&P 500 Total Return Index and Brent crude oil were mostly uncorrelated prior to the conflict. After the conflict began, however, rising oil prices increasingly coincided with weaker equity-market performance.
This is a useful reminder that financial-market relationships are not permanent. Historical data remain useful, but they describe what has happened. Investors also need information about how markets are pricing what might happen next. That is one reason we look to the options market.
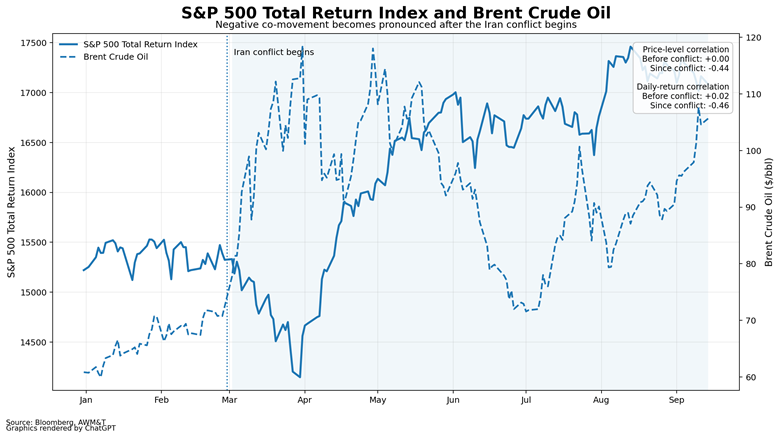
Exhibit 1. S&P 500 Total Return Index and Brent Crude Oil
What Information Is Embedded in an Option Price?
An option is a contract whose value depends on what happens to another security in the future. Some options provide protection against declines. Others provide exposure to substantial increases. Options trade at many different exercise prices, or strikes, and their prices change as investors reassess risk.
Taken together, those prices contain considerably more information than a single stock or index price. By examining options across many strike prices, we can construct what is known as an implied return distribution. The terminology sounds more complicated than the underlying idea. Rather than asking where the market will be in 60 days, we ask what range of 60-day outcomes is currently reflected in options prices, and what the shape of that range tells us about risk.
There is an important distinction here. An options-implied distribution is not a forecast of what investors think will happen. Options prices, rather, reflect the demand for insurance, investors’ willingness to bear risk, liquidity conditions, and other risk premiums. A better description is that options tell us how the market is pricing the consequences of different possible outcomes.
Looking at Both Sides of Risk
Exhibit 2 compares the implied upside and downside volatilities of our current domestic equity “with funds” model and 24 funds in our investment universe, which are divided into groups by color. The groups are determined by the similarity of the funds’ historical returns. We discuss this further in the next section. One way we summarize the information in the options-implied return distributions is to examine their upper and lower tails. For each fund and for the current portfolio, we calculate a measure of the dispersion of the most favorable 10% of outcomes and a corresponding measure for the least favorable 10%. In Exhibit 2, we refer to these as implied upside volatility and implied downside volatility.
The purpose is not to find investments with the highest possible upside. Nor is it simply to minimize volatility. We are interested in the balance between favorable and unfavorable outcomes, including just how much model volatility is appropriate.
As Exhibit 2 shows, the orange technology and growth ETFs are spread linearly across the chart (at the end of the commentary we list the full names of each of the ETFs mentioned). More specialized exposures such as semiconductors (SOXX) and AI-related funds (AIQ) tend to exhibit larger implied tail movements, while broader vehicles such as QQQ and VUG show the dampening effect of diversification. The blue group contains a defensive core that includes healthcare (XLV), pharmaceuticals (PPH), and medical devices (IHI), together with consumer staples (XLP) and utilities (XLU). The green group is concentrated in what might broadly be called the real economy: industrials (XLI), infrastructure (PAVE), materials (XLB), smaller companies (IWM), and financials (XLF).
Energy remains different. XLE is shown in a separate color because the behavior of energy equities can be dominated by oil prices, and the current geopolitical environment has made that distinction especially important. Indeed, XLE’s implied upside currently exceeds its implied downside—a very different pattern from the broader equity market, suggesting that investors may be anticipating a higher likelihood of higher oil prices given the conflict than lower oil prices. A development that therefore represents a risk to energy consumers can simultaneously create favorable outcomes for energy producers.
The comparison between our current portfolio (“CurPort”) and the S&P 500 (SPY) is also noteworthy. The current portfolio’s implied downside is somewhat lower than SPY’s, while its implied upside is modestly higher. The differences should not be interpreted as forecasts, but they are directionally consistent with the more favorable asymmetry we seek in portfolio construction. The intelligence provided by options prices is what allows us to create a customized return profile with those asymmetric characteristics.
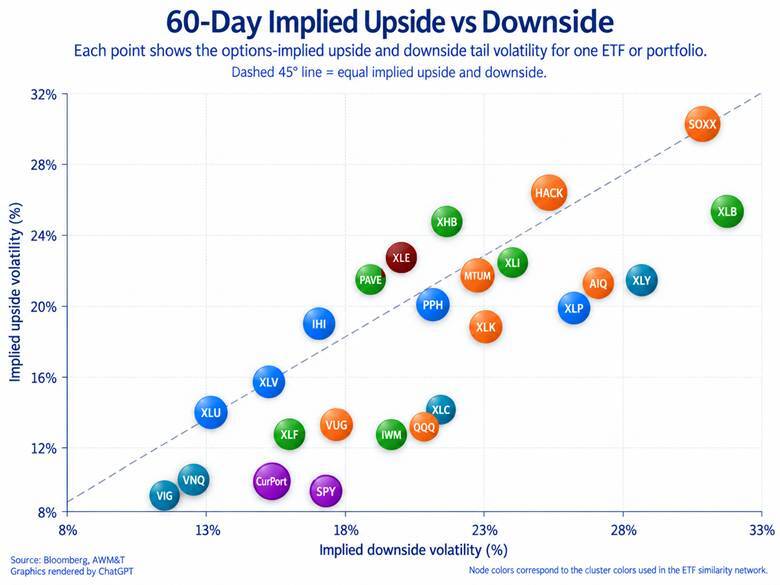
Exhibit 2. 60-Day Implied Upside vs. Downside
Knowing What Is Different—and What Is Merely a Different Label
A second challenge in portfolio construction is determining whether two investments actually provide different economic exposures. Owning several different ETFs does not necessarily mean that a portfolio is well diversified. Two funds with different names and investment mandates can still behave very similarly.
To address that issue, we examine the historical tracking error among the ETFs in our investment universe. Tracking error measures how much the returns of two investments differ from one another over time. Low tracking error means two funds have behaved similarly. High tracking error means their historical return patterns have been more distinct.
Exhibit 3 displays these relationships as a network. The distance between connected funds provides an intuitive way to see similarity. Funds with very low tracking error sit close together; funds with more distinct historical behavior sit farther apart. The two purple nodes showing SPY and our current model are especially instructive. Historically, the annualized tracking error between the two (assuming the model allocation stayed constant at today’s weights) has been relatively low, which is why the two nodes sit so close together. The projected tracking error will be higher because we seek to exploit asymmetries priced into the current market.
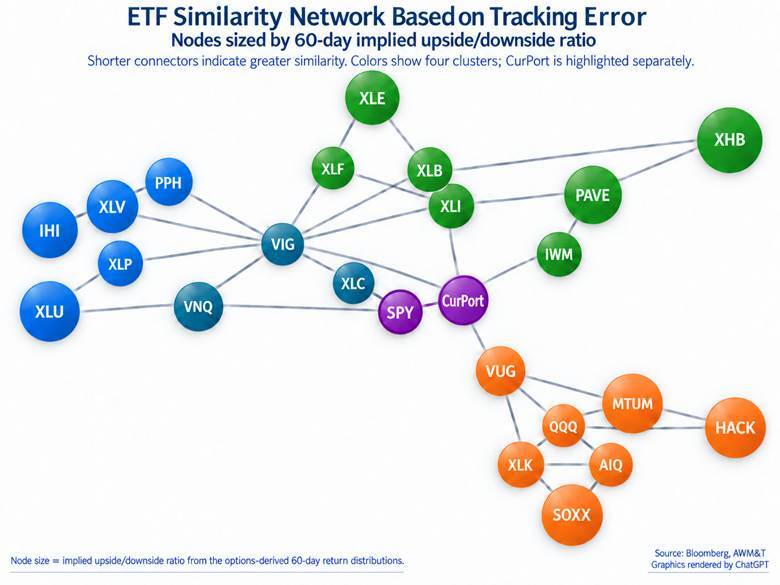
Exhibit 3. ETF Similarity Network Based on Tracking Error
From Information to Portfolio Construction
The network chart asks how sectors and ETFs have behaved in the past. The options analysis asks how the market is currently pricing the range of future outcomes. Neither question is sufficient by itself. An ETF may have attractive implied upside and downside characteristics but provide little diversification from another exposure already in the portfolio. Conversely, an investment may offer substantial diversification but have an unattractive options-implied risk profile. Our process attempts to incorporate both pieces of information.
Exhibit 4 takes the analysis one step further. It plots simulated 60-day outcomes for SPY on the horizontal axis and the portfolio’s active return—defined as current portfolio return minus SPY return—on the vertical axis. Each point represents one simulated path, while the dashed curve represents expected active return across the range of market outcomes.
The exhibit illustrates the performance profile we seek. The expected active-return curve bends upward as SPY outcomes become more extreme, indicating that the portfolio is modeled to add value not only in severe down-market scenarios but also in stronger up markets. Put differently, the portfolio is not designed simply to lag less in weak markets; it also seeks to participate meaningfully when conditions are favorable. This is why we commented earlier that the projected tracking error of the current model will likely be higher in the future than in the past. That’s by design. In fact, we can break down the variance in returns into “good” and “bad” tracking error. Good tracking error occurs when the active return is expected to be positive; bad tracking error occurs when the active return is expected to be negative. When we construct client portfolios, we seek to maximize the good tracking error while minimizing the bad tracking error. In visual terms, we design the portfolios to maximize the curvature of the dashed line in Exhibit 4 while limiting the number and extent of simulated observations that fall below zero. We believe that this can really only be achieved by incorporating the information embedded in the options market.
One additional feature of Exhibit 4 is worth noting. The dispersion of points when SPY return is at or above zero is visibly wider than the dispersion when SPY return is below zero. There are two reasons for this. First, we model up markets and down markets separately. Second, correlations among equities tend to converge to a greater extent in down markets than they do in up markets. When stocks decline together, return differences across holdings often compress; when markets rise, there is usually more room for cross-sectional differentiation. The result is a tighter cloud of active returns in down-market scenarios and a wider cloud in up-market scenarios.
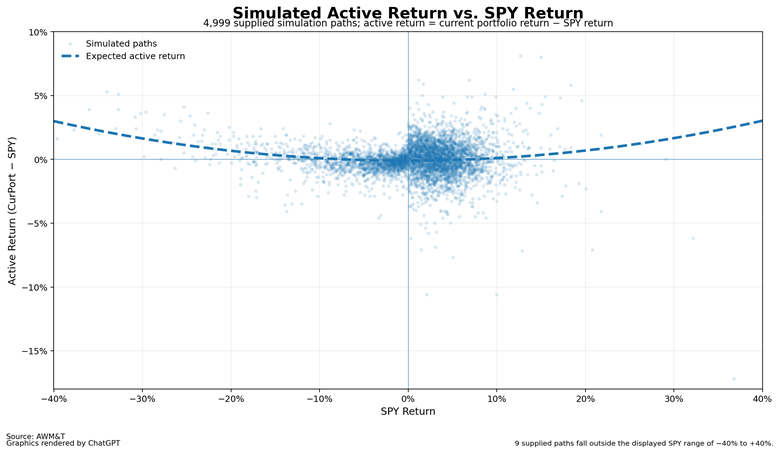
Exhibit 4. Simulated Active Return vs. SPY Return
Conclusion
This brings us back to the military analogy. Good intelligence does not tell a commander exactly what will happen next. Aerial reconnaissance may identify several possible avenues of approach. Signals intelligence may reveal increased activity. Satellite imagery may identify concentrations that were not previously visible. None of those observations guarantees a particular outcome. The value of intelligence is that it improves the commander’s understanding of the environment and allows forces to be positioned more intelligently before the outcome is known.
We think options information should be viewed in the same way. Options prices will not tell us whether the S&P 500 will rise or fall next month. What they can provide is another perspective on the risk environment—one derived from the actual prices investors are currently willing to pay for protection and participation across a wide range of possible outcomes.
Historical tracking error tells us how different investments have behaved relative to one another. Options markets provide information about how investors are currently pricing future uncertainty. Economic and geopolitical analysis helps us understand why those relationships may be changing. Taken together, those sources of information can help us construct portfolios that we believe are better positioned across a range of possible outcomes.
For investors, as for military decision-makers, uncertainty is unavoidable. The goal is not to eliminate it. The goal is to make better-informed decisions while operating within it.
Here’s looking forward to a beautiful Fall.
Yours in Trust,
Appendix: List of ETFs Referenced
|
Ticker |
Name |
Description |
|
AIQ |
Global X Artificial Intelligence & Technology ETF |
Global X Funds Global X Artificial Intelligence & Technology ETF is an exchange traded fund incorporated in the USA. The Fund seeks to track the performance of the Index Artificial Intelligence and Big Data Index. The index tracks companies in developed markets positioned to benefit from the utilization of artificial intelligence technology in their products and services. |
|
HACK |
Amplify Cybersecurity ETF |
Amplify Cyber Security ETF seeks investment results that generally correlate (before fees and expenses) to the total return performance of the Nasdaq ISE Cyber Security Select Index. HACK tracks a portfolio of companies actively involved in providing cybersecurity solutions that include hardware, software, and services. |
|
IHI |
iShares U.S. Medical Devices ETF |
iShares U.S. Medical Devices ETF is an exchange-traded fund incorporated in the USA. The ETF tracks the performance of the Dow Jones US Select Medical Equipment Index. The ETF holds health care stocks of varying cap sizes. Its investments are focused in health care equipment and supplies. The ETF weights the holdings by market capitalization. |
|
IWM |
iShares Russell 2000 ETF |
iShares Russell 2000 ETF is an exchange-traded fund incorporated in the USA. The ETF tracks the performance of the Russell 2000 Index. The ETF holds mid and small-cap U.S. stocks. Its investments are in the smallest 2000 companies from the Russell 3000 Index. The ETF weights the holdings by market capitalization and rebalances annually. |
|
MTUM |
iShares MSCI USA Momentum Factor ETF |
iShares MSCI USA Momentum Factor ETF is an exchange traded fund incorporated in the USA. The Fund seeks to track the performance of an index that measures the performance of U.S. large and mid capitalization stocks exhibiting relatively higher momentum characteristics, before fees and expenses. |
|
PAVE |
Global X US Infrastructure Development ETF |
Global X U.S. Infrastructure Development ETF is an exchange traded fund incorporated in the USA. The ETF tracks the Index U.S. Infrastructure Development Index, which measures the performance of U.S. listed companies that provide exposure to domestic infrastructure development, including companies involved in construction and engineering, production of raw materials along with others. |
|
PPH |
VanEck Pharmaceutical ETF |
VanEck Pharmaceutical ETF is an exchange-traded fund incorporated in the USA. The Fund seeks to track the performance of the US Listed Pharmaceutical25 Index. The Pharmaceutical Index is comprised of equities of U.S. listed companies in the pharmaceutical sector. Such companies may include medium cap companies and foreign companies that are listed on a U.S. exchange. |
|
QQQ |
Invesco QQQ Trust Series 1 |
Invesco QQQ Trust Series 1 is an exchange-traded fund incorporated in the USA. The ETF tracks the Nasdaq 100 Index, which includes 100 of the largest non-financial companies by market cap listed on Nasdaq. The Index reflects companies across major industry groups including computer hardware and software, telecommunications, retail/wholesale trade and biotechnology. |
|
SOXX |
iShares Semiconductor ETF |
iShares Semiconductor ETF is an exchange-traded fund incorporated in the USA. The ETF's objective seeks investment results that correspond to the performance of the ICE Semiconductor Index which is composed of U.S.-listed equities in the semiconductor sector. |
|
SPY |
State Street SPDR S&P 500 ETF Trust |
State Street SPDR S&P 500 ETF Trust is an exchange-traded fund incorporated in the USA. The ETF tracks the S&P 500 Index. The Trust consists of a portfolio representing all 500 stocks in the S&P 500 Index. It holds predominantly large-cap U.S. stocks. This ETF is structured as a Unit Investment Trust and pays dividends on a quarterly basis. The holdings are weighted by market capitalization. |
|
VIG |
Vanguard Dividend Appreciation ETF |
Vanguard Dividend Appreciation ETF is an exchange-traded fund incorporated in the USA. The ETF tracks the S&P US Dividend Growers Index. The ETF holds mid and large-cap U.S. stocks. Its investments are focused on U.S. common stocks that have a history of increasing dividends for ten consecutive years, but exclude REITs. The ETF weights the holdings by market capitalization. |
|
VNQ |
Vanguard Real Estate ETF |
Vanguard Real Estate ETF is an exchange-traded fund incorporated in the USA. The Fund seeks to track the performance of the MSCI US IMI 25/50 Real Estate Index. The Fund invests in the stocks that make up the Index, holding each stock in the same proportion as its weighting in the Index; the remaining assets are allocated to cash investments. |
|
VUG |
Vanguard Morningstar Growth ETF |
Vanguard Morningstar Growth ETF is an exchange-traded fund incorporated in the USA. The Fund seeks to track the performance of the Morningstar U.S. Large Cap Growth Index. The ETF holds large-cap U.S. stocks. The Fund invests all of its assets in the stocks that make up the Index and follows a full replication strategy. It weights the holdings using a multi factor methodology. |
|
XHB |
State Street SPDR S&P Homebuilders ETF |
State Street SPDR S&P Homebuilders ETF is an exchange-traded fund incorporated in the USA. The Fund seeks to replicate the performance of the S&P Homebuilders Select Industry Index, an equal-weighted index. The Index tracks all the US common stocks listed on the NYSE, American Stock Exchange, NASDAQ National Market and NASDAQ Small Cap exchanges. |
|
XLB |
State Street Materials Select Sector SPDR ETF |
State Street Materials Select Sector SPDR ETF is an exchange-traded fund incorporated in the USA. The Fund's objective is to provide investment results that correspond to the performance of the Materials Select Sector Index. The Index includes companies from the following industries: chemicals, construction materials, containers and packaging. |
|
XLC |
State Street Communication Services Select Sector SPDR ETF |
State Street Communication Services Select Sector SPDR ETF is an exchange-traded fund incorporated in the USA. It tracks the Communication Services Select Sector Index. The fund will invest in companies from the following industries: diversified telecommunication services; wireless telecommunication services; media; entertainment; and interactive media & services. |
|
XLE |
State Street Energy Select Sector SPDR ETF |
State Street Energy Select Sector SPDR ETF is an exchange-traded fund incorporated in the USA. The ETF tracks the performance of the Energy Select Sector Index. The ETF holds large-cap U.S. energy stocks. It invests in companies that develop & produce crude oil & natural gas, provide drilling and other energy related services. The holdings are weighted by market capitalization. |
|
XLF |
State Street Financial Select Sector SPDR ETF |
State Street Financial Select Sector SPDR ETF is an exchange-traded fund incorporated in the USA. The Fund's objective is to provide investment results that, before expenses, correspond to the performance of The Financial Select Sector. The Index includes financial services firms whose businesses range from investment management to commercial & business banking. |
|
XLI |
State Street Industrial Select Sector SPDR ETF |
State Street Industrial Select Sector SPDR ETF is an exchange-traded fund incorporated in the USA. The ETF tracks the performance of The Industrial Select Sector Index. The ETF holds large cap U.S. industrials stocks. Its investments are focused on industrial products, including electrical & construction equipment, waste management and machinery. The ETF weights the holdings by market capitalization. |
|
XLK |
State Street Technology Select Sector SPDR ETF |
State Street Technology Select Sector SPDR ETF is an exchange-traded fund incorporated in the USA. The ETF tracks the performance of The Technology Select Sector Index. The ETF holds large and mid-cap technology stocks. Its largest investment allocation is in the United States. The ETF weights the holdings using a market capitalization methodology. |
|
XLP |
State Street Consumer Staples Select Sector SPDR ETF |
State Street Consumer Staples Select Sector SPDR ETF is an exchange-traded fund incorporated in the USA. The ETF tracks The Consumer Staples Select Sector Index. The ETF holds large cap consumer staples stocks. Its holdings include cosmetic and personal care, pharmaceuticals, soft drinks, tobacco and food products. The ETF weights the holdings using a market capitalization methodology. |
|
XLU |
State Street Utilities Select Sector SPDR ETF |
State Street Utilities Select Sector SPDR ETF is an exchange-traded fund incorporated in the USA. The Fund's objective is to provide investment results that correspond to the performance of The Utilities Select Sector Index. The Index includes communication services, electrical power providers and natural gas distributors. |
|
XLV |
State Street Health Care Select Sector SPDR ETF |
State Street Health Care Select Sector SPDR ETF is an exchange-traded fund incorporated in the USA. The Fund's objective is to provide investment results that correspond to the performance of The Health Care Select Sector Index. The Index includes companies involved in health care equipment and supplies, health care providers and services, biotechnology & pharmaceuticals. |
|
XLY |
State Street Consumer Discretionary Select Sector SPDR ETF |
State Street Consumer Discretionary Select Sector SPDR ETF is an exchange-traded fund incorporated in the USA. The ETF tracks the performance of the Consumer Discretionary Select Sector Index holding primarily large capitalization companies domiciled in the US. The ETF weights its holdings using a modified market cap approach, generally investing at least 95% of its assets in the index. |
Source: AWM&T, Bloomberg
Secure Your Financial Future with AWM&T
At AAFMAA Wealth Management & Trust LLC, we are committed to serving the unique financial needs of the military community. Whether you require a complimentary portfolio review, a comprehensive financial plan, assistance with your investment strategy, or trust services, our military wealth management professionals are ready to serve you. Contact us today to set up an appointment with a Relationship Manager who can assess your financial health and customize your personalized action plan.
About Us
Founded in 2012, AAFMAA Wealth Management & Trust LLC (AWM&T) was created to meet the distinct financial needs of military families. We proudly deliver experienced, trustworthy financial planning, investment management, and trust administration services – all designed to promote lasting security and independence.
We are proud to share the mission, vision, and values of Armed Forces Mutual, our parent company. We consistently build on the Association’s rich history and tradition to provide our Members with a source of compassion, trust, and protection. At AWM&T, we are committed to serving as your trusted fiduciary, always putting your best interests first. Through Armed Forces Mutual's legacy and our financial guidance, we provide personalized wealth management solutions to military families across generations.
© 2026 AAFMAA Wealth Management & Trust LLC. Information provided by AAFMAA Wealth Management & Trust LLC is not intended to be tax or legal advice. Nothing contained in this communication should be interpreted as such. We encourage you to seek guidance from your tax or legal advisor. Past performance does not guarantee future results. Investments are not FDIC or SIPC insured, are not deposits, nor are they insured by, issued by, or guaranteed by obligations of any government agency or any bank, and they involve risk including possible loss of principal. No information provided herein is intended as personal investment advice or financial recommendation and should not be interpreted as such. The information provided reflects the general views of AAFMAA Wealth Management & Trust LLC but may not reflect client recommendations, investment strategies, or performance. Current and future financial environments may not reflect those illustrated here. Views of AAFMAA Wealth Management & Trust LLC may change based on new information or considerations.
Get In Touch!
Schedule a consultation with one of our expert financial planners today, and let's hit the fast-track to success!
Schedule A ConsultationRelated posts
February 2025 Market Commentary
Read more
May 2025 Market Commentary
Read more