

February 2024 Commentary
Economic and Market Commentary
The last time that the Federal Reserve cut interest rates was on March 13, 2020, as the economic enormity of COVID began to become apparent. Almost exactly two years later, the Fed began an unprecedented 16-month series of rate hikes, bringing its target rate lower bound from 0.0% to 5.25%. Currently, everyone from first-time homebuyers to retirees and bond market vigilantes is anticipating the first Fed rate cut of the next cycle. While we don’t know exactly when that will happen, it’s not too early to begin thinking about how events correlated with that first cut might impact financial markets and investment portfolios. In this commentary, we ask a simple question to help us understand the potential implications for investment strategy: what happened in prior periods once the Fed started cutting rates?
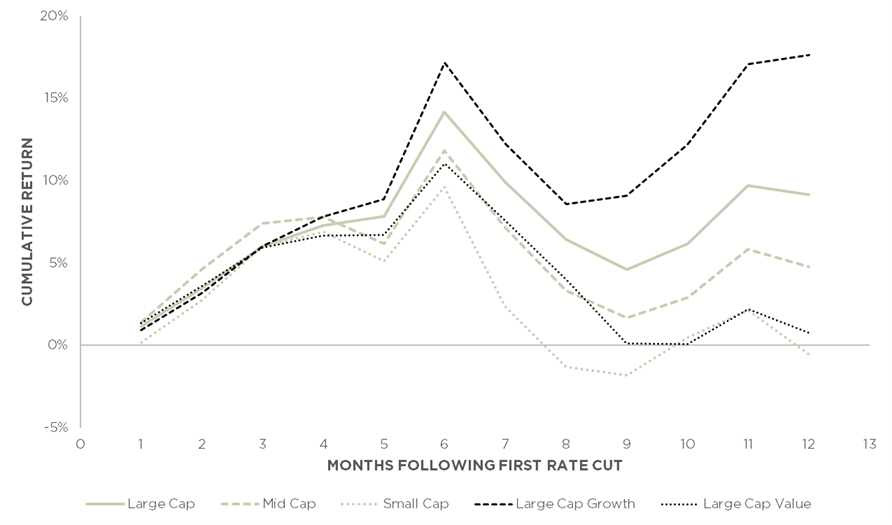
Here are our results for different slices of the stock market. We look specifically at cumulative price returns for various stock indexes for the 12 months following the first rate cut of each rate cut cycle beginning in 1979. Exhibit 1 displays average 3-month, 6-month, and 12-month cumulative price returns.
Exhibit 1. Large Cap, Large Cap Growth, Large Cap Value, Mid Cap, and Small Cap Stock Index Cumulative Price Returns Following the First Fed Rate Cut of Each Rate Cut Cycle, 1979-2023

Source: Bloomberg, AAFMAA Wealth Management & Trust
The results are divided into recessionary and non-recessionary periods because there are very clear differences in performance during those periods. We’ve developed a model that forecasts the probability of recession over the next 12 months. It currently forecasts a 6.5% probability; as a result, we’ve highlighted the largest historical returns among all of the indexes in the non-recessionary environments.
Based on the historical data we used to produce Exhibit 1, Exhibit 2 shows what the cumulative 12 months of price returns following the next Fed rate hike might look like assuming (1) a 6.5% probability of recession, and (2) that price returns match their historical averages. Under these circumstances, mid cap stocks perform well over the first three months. After that, large cap growth and the overall large cap universe perform quite robustly. We believe that the Fed is unlikely to cut rates before late Spring or early Summer. If we assume that the Fed’s first cut will occur in June, then we can think of the chart in Exhibit 2 as estimating expected returns from June 2024 through June 2025. While we don’t show the analytical results here, historical data also suggest that each of the indexes in the four months preceding the first rate cut in a non-recessionary environment would likely realize additional positive returns.
Exhibit 2. Average Large Cap, Large Cap Growth, Large Cap Value, Mid Cap, and Small Cap Cumulative Price Returns Following the First Fed Rate Cut of Each Rate Cut Cycle, Assuming 6.5% Probability of Recession, 1979-2023
Source: Bloomberg, AAFMAA Wealth Management & Trust
How Do We Reach These Conclusions?
For simplicity, we focus on U.S. large, mid, and small cap equity indexes, large cap growth and value indexes, and the slope of the yield curve. We look specifically at cumulative price returns for each of the equity indexes in the 12 months following the first rate cut. We also look at cumulative changes in the slope of the yield curve. The objective is to understand the historical impact of cuts on the equity market and the subsequent differences in performance among the indexes.
Our analysis is based on monthly price returns and yield curve changes from January 1979 through December 2023 for the Russell 1000 (large cap), Russell Midcap (mid cap), Russell 2000 (small cap), and Russell 1000 Growth and Value indexes. The period includes 18 rate-cut and rate-hike cycles. A rate cut cycle is defined as the period beginning in the month of the first rate cut following a rate hike and ending in the month immediately before the next rate hike. Likewise, a rate hike cycle is defined as the period beginning the month of the first rate hike following a rate cut and ending in the month immediately before the next rate cut.
Rate cut and rate hike cycles before 1989 tended to be shorter and reflected pre-Alan Greenspan monetary policy that was less sympathetic to market participants than that of the modern era. From 1979 to early 1988, there were 12 rate cut cycles lasting an average of five months each; since late 1989, there have been six rate cut cycles averaging 43 months each. In the pre-1989 period, rate cuts tended to benefit small- and mid-cap stocks more than they did large-cap stocks; since then, the results have been more ambiguous.
Recession or No Recession?
As a starting point, Exhibit 3 takes a look at the cumulative return of the large cap index in each of the months following the first rate cut through either the last month of the cycle or the twelfth month of the cycle, whichever comes first. Each line represents a single cycle, and the label at the end of each line denotes either the date of the end of the cycle or the date of the twelfth month. Aside from the increase in dispersion of returns over time (which is expected), there is no obvious pattern.
Exhibit 3. Large Cap Stock Cumulative Price Returns Following the First Fed Rate Cut of Each Rate Cut Cycle, 1979-2023
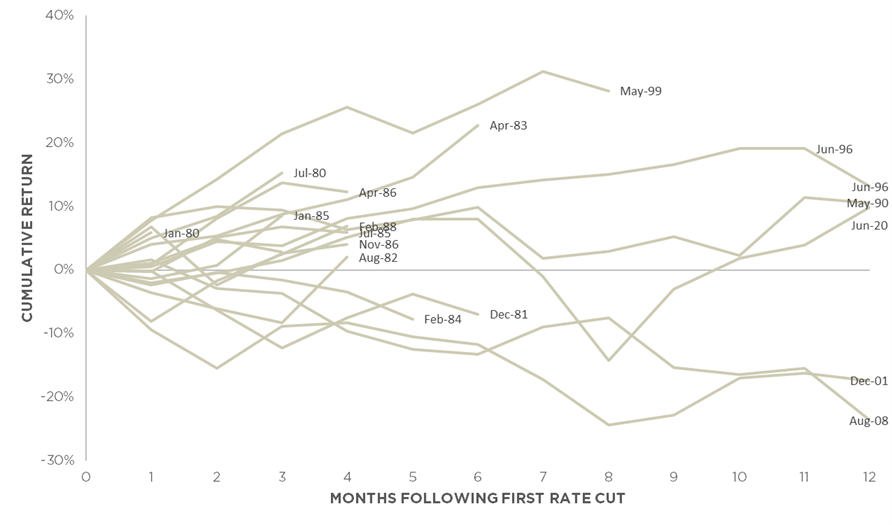
Source: Bloomberg, AAFMAA Wealth Management & Trust
However, there is actually more information in the chart than may be obvious. The Fed has a dual mandate to promote maximum employment and stable prices, one tangible goal of which would be to keep or bring the economy out of recession. Under that lens, we would expect the Fed to cut rates proactively as appropriate to avoid recession or provide necessary stimulus to end an existing recession. The Fed’s propensity to avoid recession is what market participants are focused on today.
Exhibit 4 shows the same chart but highlights rate cut cycles that either occurred during a recession or started or ended within one month of a recession (black lines in the chart). With the exception of the one- and three-month cycles ending in January and July 1980, large cap equity performance following a first Fed rate cut has been pronouncedly negative during recessionary periods and positive during non-recessionary periods. That makes sense.
Exhibit 4. Large Cap Stock Cumulative Price Returns Following the First Fed Rate Cut of Each Rate Cut Cycle, 1979-2023, Separated by Rate Cut Cycles that Occurred In Or Around Recessions (Black Curves) and Rate Cut Cycles that Did Not (Tan Curves)
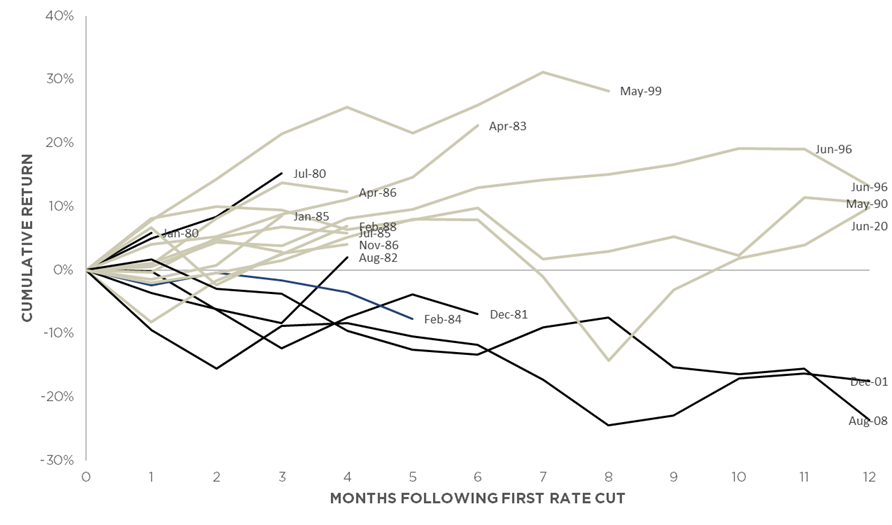
*We use the recession dates determined by the National Bureau of Economic Research.
Source: Bloomberg, AAFMAA Wealth Management & Trust
Mid cap and small cap equity indexes follow similar historical patterns — negative performance in recessionary periods and positive performance otherwise. Exhibit 5 averages the performance of each of the large, mid, and small cap indexes by month following the first rate cut in both recessionary and non-recessionary environments. The chart suggests that in recessionary environments, mid and small cap stocks have had less negative price returns than large cap stocks. In non-recessionary environments, mid cap outperformed through month three, while large cap outperformed following that.
Exhibit 5. Average Large, Mid, and Small Cap Stock Cumulative Price Returns Following the First Fed Rate Cut of Each Rate Cut Cycle, 1979-2023
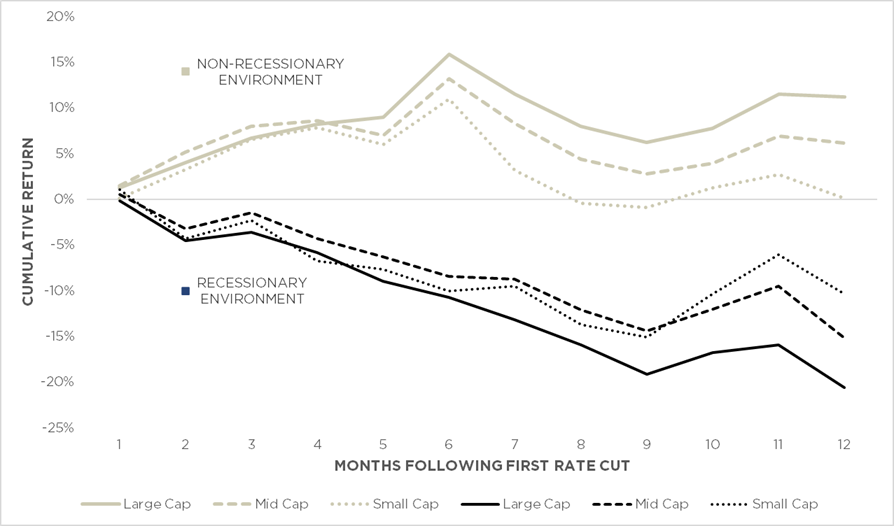
Source: Bloomberg, AAFMAA Wealth Management & Trust
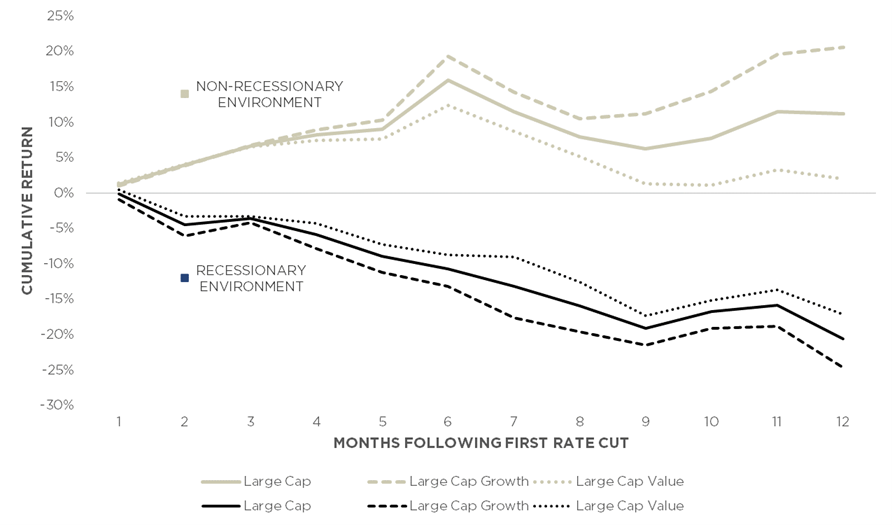
Exhibit 6 shows the same analysis for large cap, large cap growth, and large cap value indexes. Exhibit 2 above combines the curves in Exhibits 5 and 6.
Exhibit 6. Average Large Cap, Large Cap Growth, and Large Cap Value Cumulative Price Returns Following the First Fed Rate Cut of Each Rate Cut Cycle, 1979-2023
Source: Bloomberg, AAFMAA Wealth Management & Trust
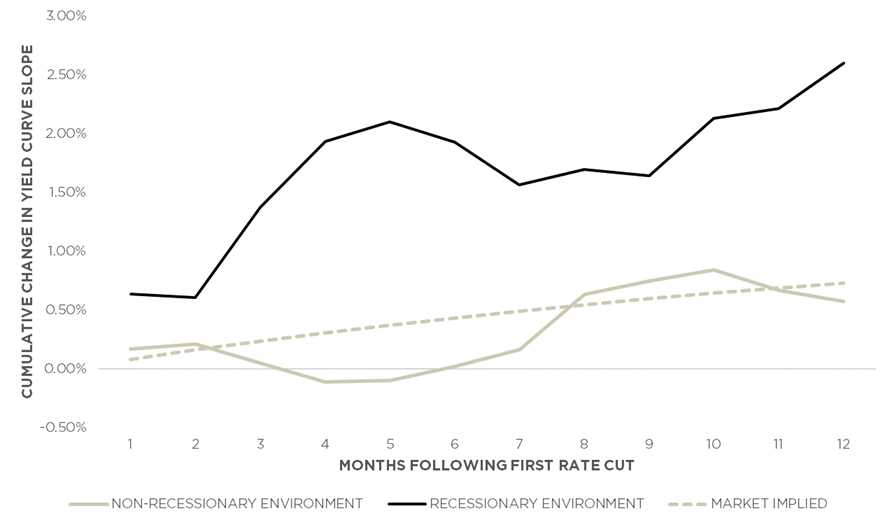
One last note worth mentioning is the historical performance of the slope of the yield curve in the same rate cut cycles, also divided into recessionary and non-recessionary periods. For this purpose, we define the slope of the yield curve as the difference in any month between the yield of the 10-year US Treasury Note and the yield of the 3-Month Treasury Bill. Currently, the difference is about -0.94%.
Exhibit 7 shows the average cumulative yield curve slope change following the first Fed rate cut in each cycle. The yield curve has generally steepened following the onset of rate cuts, more severely in recessionary environments (black curve) and less severely in non-recessionary environments (tan curve). What we find quite interesting is that the future slope of the yield curve implied by current market pricing tracks the non-recessionary average very closely, which can be interpreted to mean that, consciously or not, the bond market is not expecting a recession. This observation gives us additional comfort in our model forecast of a low, 6.5% probability of recession.
Exhibit 7. Average Cumulative Change in Yield Curve Slope Following the First Fed Rate Cut of Each Rate Cut Cycle, 1979-2023
Source: Bloomberg, AAFMAA Wealth Management & Trust
Our analysis reinforces our view that 2024, and likely 2025, will enjoy positive, average equity returns.
Thank you for making it this far.
Yours In Trust,
Paul
Advance Your Finances with AWM&T
At AAFMAA Wealth Management & Trust LLC, we are committed to serving the unique financial needs of the military community. Whether you require a complimentary portfolio review, a comprehensive financial plan, assistance with your investment strategy, or trust services, our military wealth management professionals are ready to serve you. Contact us today to set up an appointment with a Relationship Manager who can assess your financial health and customize your personalized action plan.
About Us
Founded in 2012, AAFMAA Wealth Management & Trust LLC (AWM&T) was created to meet the distinct financial needs of military families. We proudly deliver experienced, trustworthy financial planning, investment management, and trust administration services – all designed to promote lasting security and independence.
We are proud to share the mission, vision, and values of Armed Forces Mutual, our parent company. We consistently build on the Association’s rich history and tradition to provide our Members with a source of compassion, trust, and protection. At AWM&T, we are committed to serving as your trusted fiduciary, always putting your best interests first. Through Armed Forces Mutual's legacy and our financial guidance, we provide personalized wealth management solutions to military families across generations.
© 2024 AAFMAA Wealth Management & Trust LLC. Information provided by AAFMAA Wealth Management & Trust LLC is not intended to be tax or legal advice. Nothing contained in this communication should be interpreted as such. We encourage you to seek guidance from your tax or legal advisor. Past performance does not guarantee future results. Investments are not FDIC or SIPC insured, are not deposits, nor are they insured by, issued by, or guaranteed by obligations of any government agency or any bank, and they involve risk including possible loss of principal. No information provided herein is intended as personal investment advice or financial recommendation and should not be interpreted as such. The information provided reflects the general views of AAFMAA Wealth Management and Trust LLC but may not reflect client recommendations, investment strategies, or performance. Current and future financial environments may not reflect those illustrated here. Views of AAFMAA Wealth Management & Trust LLC may change based on new information or considerations.
Get In Touch!
Schedule a consultation with one of our expert financial planners today, and let's hit the fast-track to success!
Schedule A ConsultationRelated posts
May 2024 Market Commentary
Read more
November 2025 Market Commentary
Read more