
I shared this chart with our Investment Team earlier this year and it was shared with our Members at the Annual Meeting in June. The blue line represents real disposable personal income. The black line represents real personal disposable income, excluding transfer payments. The blue line shows the extent to which the federal government rained down helicopter money on the United States as the initial pandemic shutdowns forced the near-closure of the global economy. You can see that real disposable income has just now, two years later, excluding transfer payments, returned to pre-Covid-19 levels. That means that there has been no real growth for the consumer in almost three years.


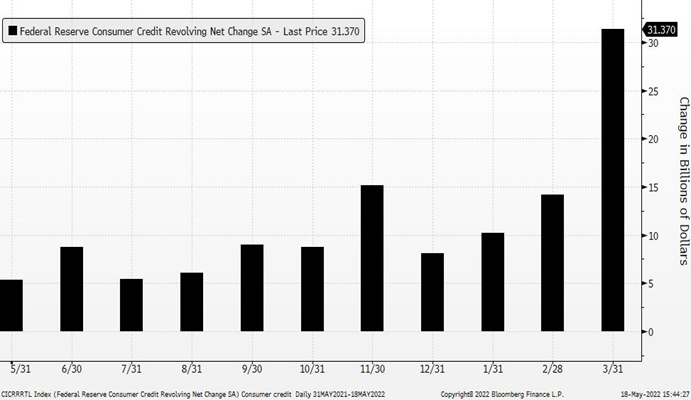
But, I hear you say, the consumer is really strong. That’s what everyone is saying. That leads me to my next chart. What if that’s just not so? What if the consumer has spent all that money and inflation is really starting to eat into the average family’s budget? They still need to buy things, but they just don’t have the cash. What to do? Put it on the credit card! It looks like that’s what is happening. This chart is only through March, but you can see that when the stimulus ends, the credit card spend begins. My guess is that April and May will look elevated as well. While major banks are telling us today that the consumer has never been stronger, data points like this potentially paint a different picture. Delinquencies and defaults on credit cards are still historically low, but coming off their all-time lows at the end of 2021. Are consumers closer to being out of cash and back to their old habits? The often-cited U.S. savings rate has fallen to 4.4%, a level not seen since the 2008 recession. The data does not paint a dire scenario right now, but it does paint a picture of a U.S. consumer clearly not as flush as they were six months ago.
Consumer credit isn’t the only thing getting tighter. The chart to the right shows High Yield (orange) and Investment Grade (blue) credit spreads expanding. Borrowing costs are going up for companies. CFO’s will be weighing heavily expansions that require the use of debt (or equity) capital. The hurdle rates of return for new projects will be higher.

What happens when credit in the bond market and credit for the consumer both dry up? Exactly what the Federal Reserve wants to happen. The euphemism is “Credit Conditions Tighten”, but that just means it gets a lot harder for everyone to finance their transactions and so they just do fewer transactions. We tighten our belts.
The chart to the right shows the “Natural Rate of Unemployment” as calculated by the CBO in black. Unemployment below this level indicates that there is not sufficient labor force movement and therefore, inflationary wage pressures are present. Over the past 40 years, unemployment has generally declined as interest rates have declined. Growth in the U.S. economy and positive labor force demographics supported by immigration led to lower inflation and higher employment. Those lower inflation expectations (coupled with lower real future growth expectations) led to declining U.S. Treasury yields (blue). Another of the Covid-19 economic side effects has been significantly lower immigration and disruptions of the normal employment market as people stayed home or retired early. While an extremely tight job market in the past decade was not inflationary, in the post-Covid-19 world, wage inflation has returned.

Our framework for evaluating investing through this environment is based around a three-stage process. In Stage One, stock and bond prices began to better reflect the path to higher interest rates. That has occurred (and may continue to occur).
We are now in Stage Two. Analysts and economists have to re-evaluate what future earnings might look like for companies as they and their customers are tightening their belts. As I write, analysts at major banks have downgraded near-term earnings prospects for companies in the auto and rail sectors – capital intensive industries with broad economic activities. Companies are reporting that things aren’t as great as they were before and are trying to make decisions about how to react and change plans. The Federal Reserve seems to be succeeding in engineering a slowdown. The Federal Reserve’s goal is a slowdown that results in lower inflation and some unemployment (but not too much).
Stage Three is either a recession, stagflation, or the “goldilocks” scenario of a return to the pre-Covid-19 environment with good growth and low inflation. The path forward is not easy or predictable. If the Federal Reserve eases too quickly, inflation may get entrenched in the system and we’ll have stagflation. Tighten too much and we may have a recession. The odds of getting it right are very hard under “normal” circumstances. Today, the United States is coming off unlimited financial support in the form of 0% Fed Funds rate and quantitative easing while inflation is 8%. A war in Europe is disrupting global agricultural and energy commodities, and China is fighting Covid-19 in 2022 with a continuation of its brutal 2020 lockdowns.
It is against this backdrop that your AAFMAA Wealth Management & Trust (AWM&T) Investment Team has elected to take down equity risk in client portfolios.
This should lower volatility across all accounts and enable us to reevaluate as the global macroeconomic picture unfolds. We are developing some scenario analysis and a menu of potential investment options that will hopefully enable us to set up portfolios appropriately for what comes next whether that is a recession, stagflation, or a return to global growth and low inflation.
Yours in Trust,
Gary Aiken
Chief Investment Officer
Index Returns by Strategy:
Strategy Index May YTD
GARP S&P 500 +0.18% -12.76%
Dividend Focus Russell 1000 Value +1.94% -4.52%
All World MSCI ACWI IMI +0.12% -12.74%
Fixed Income BBG Intermediate US Govt/Corp +0.74% -5.72%
(Source: Bloomberg L.P.)
At AAFMAA Wealth Management & Trust, we are dedicated to making your financial future as secure as possible. We provide all you need to know about post-retirement military wealth management, starting with a free portfolio review. We strive to learn about your goals and your level of risk tolerance and help you chart your course, build your wealth, and plan your legacy. For all you have done for us, it is the least we can do for you. Your selfless service to our nation deserves our unparalleled military financial service. We salute you.
Related posts
Monthly Market Commentary – October 2022
Read more
Monthly Market Commentary – September 2022
Read more